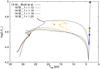
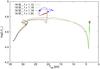
Fig. 2
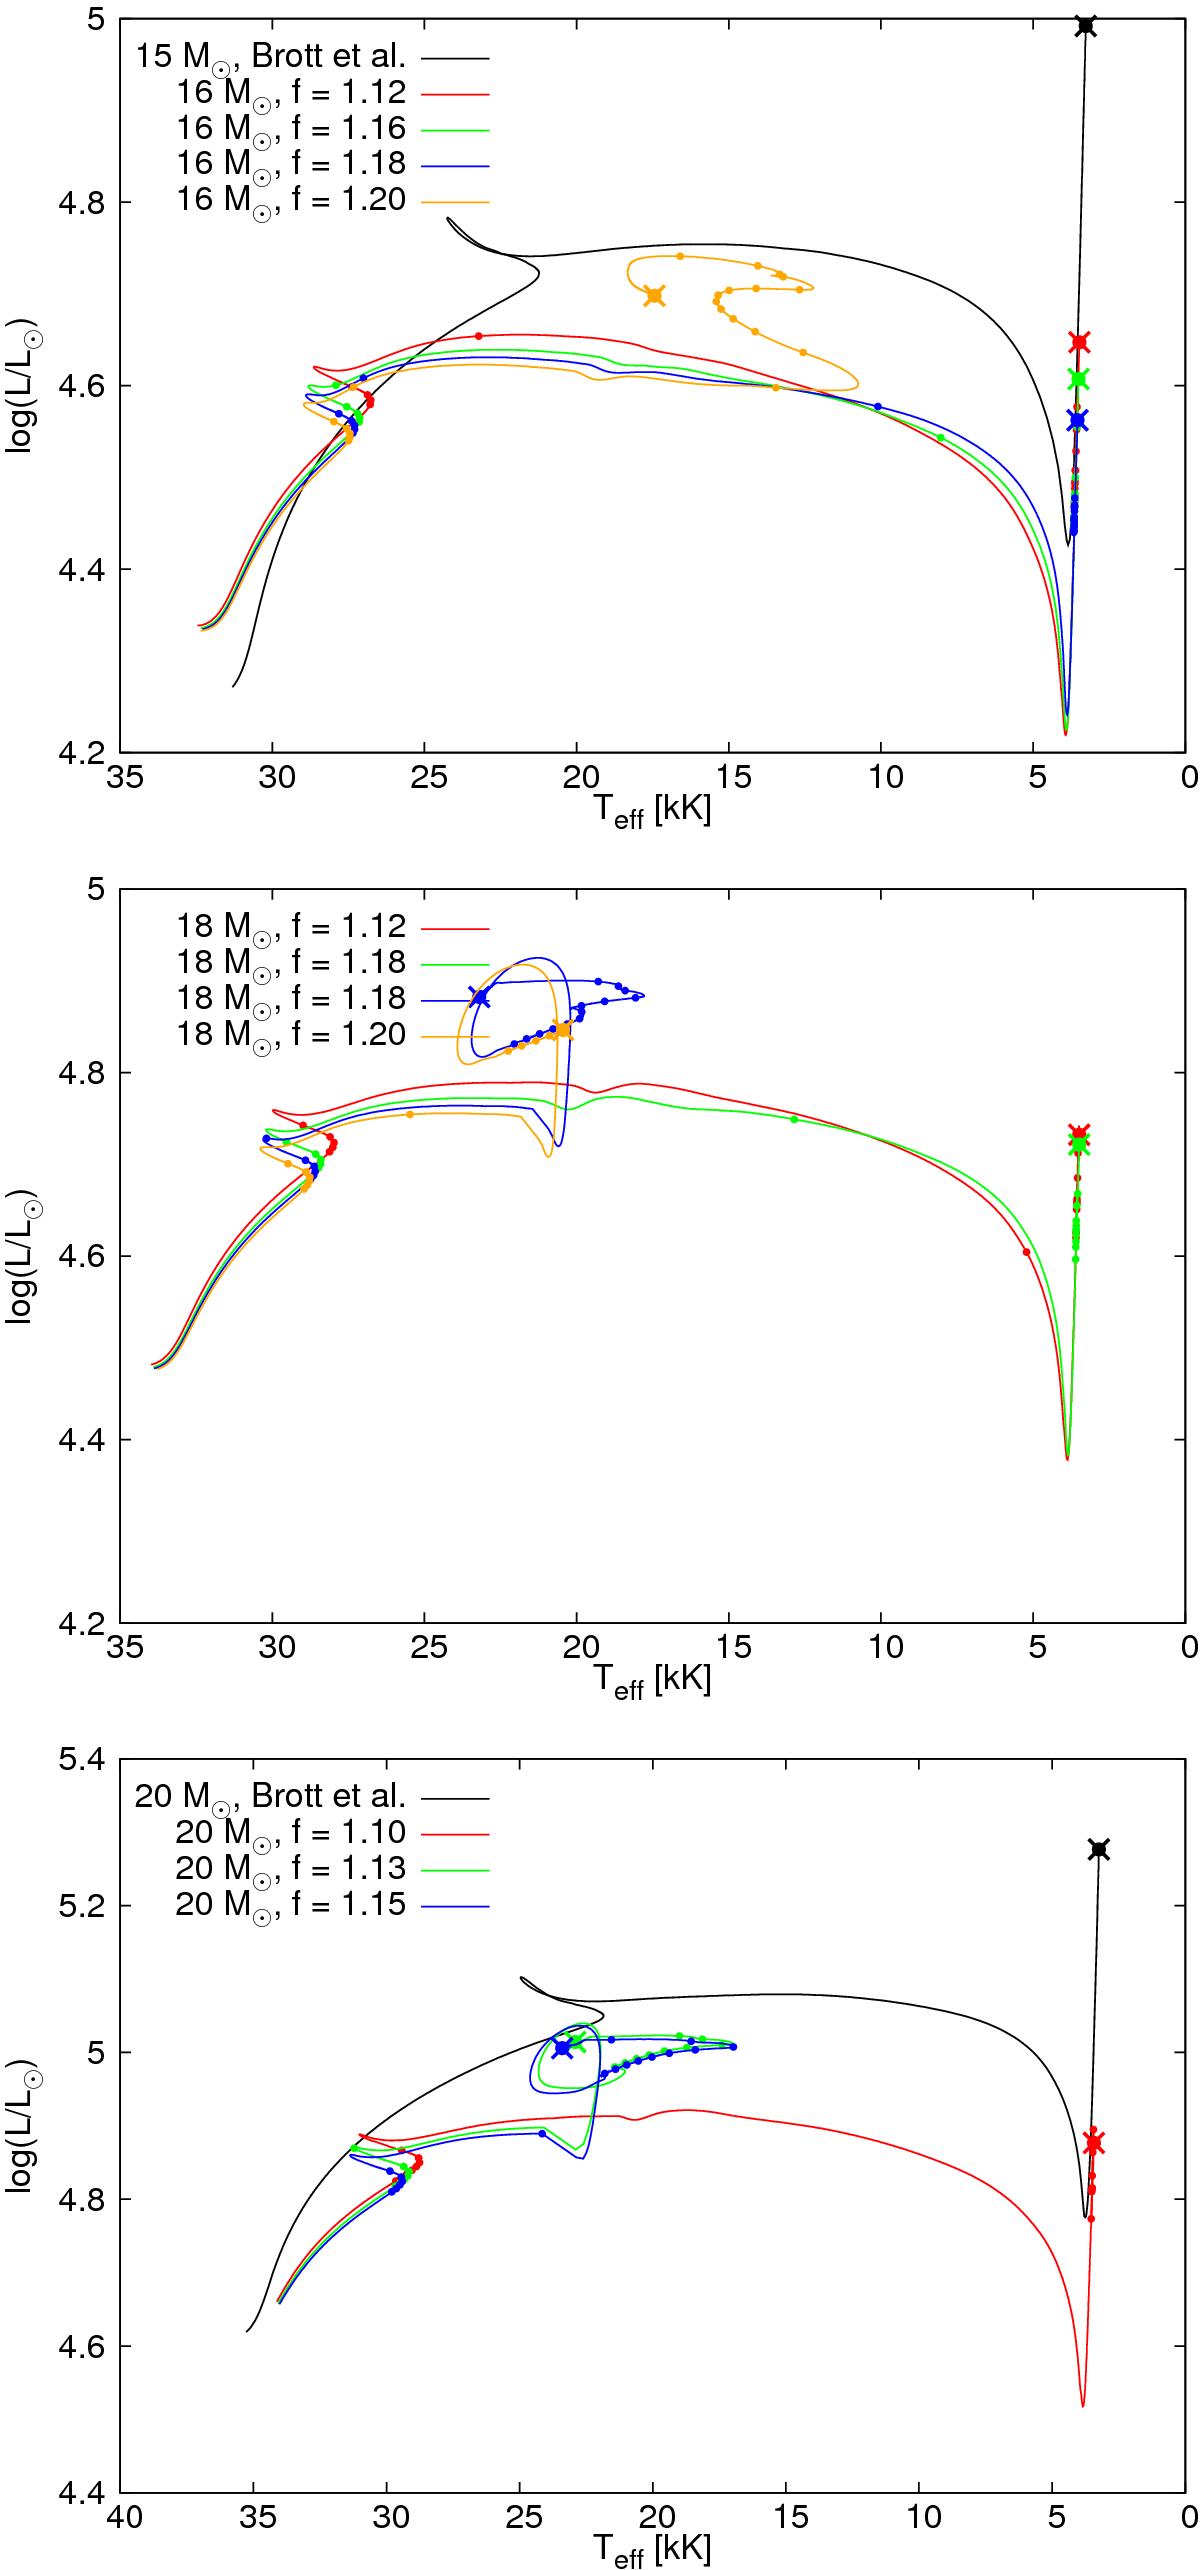
Evolutionary tracks of stars with M = 16, 18 and 20 M⊙, computed with different core reduction parameters as indicated, in the HR diagram. For the post main sequence phases, small dots are placed on the tracks every 105 yr to indicate the speed of evolution of the models in the HR diagram. The large circle indicates the presupernova position of the models. For comparison, tracks for 15 and 20 M⊙ stars of non-rotating models with solar metallicity by Brott et al. (2011) are also shown.
Current usage metrics show cumulative count of Article Views (full-text article views including HTML views, PDF and ePub downloads, according to the available data) and Abstracts Views on Vision4Press platform.
Data correspond to usage on the plateform after 2015. The current usage metrics is available 48-96 hours after online publication and is updated daily on week days.
Initial download of the metrics may take a while.