Fig. 1
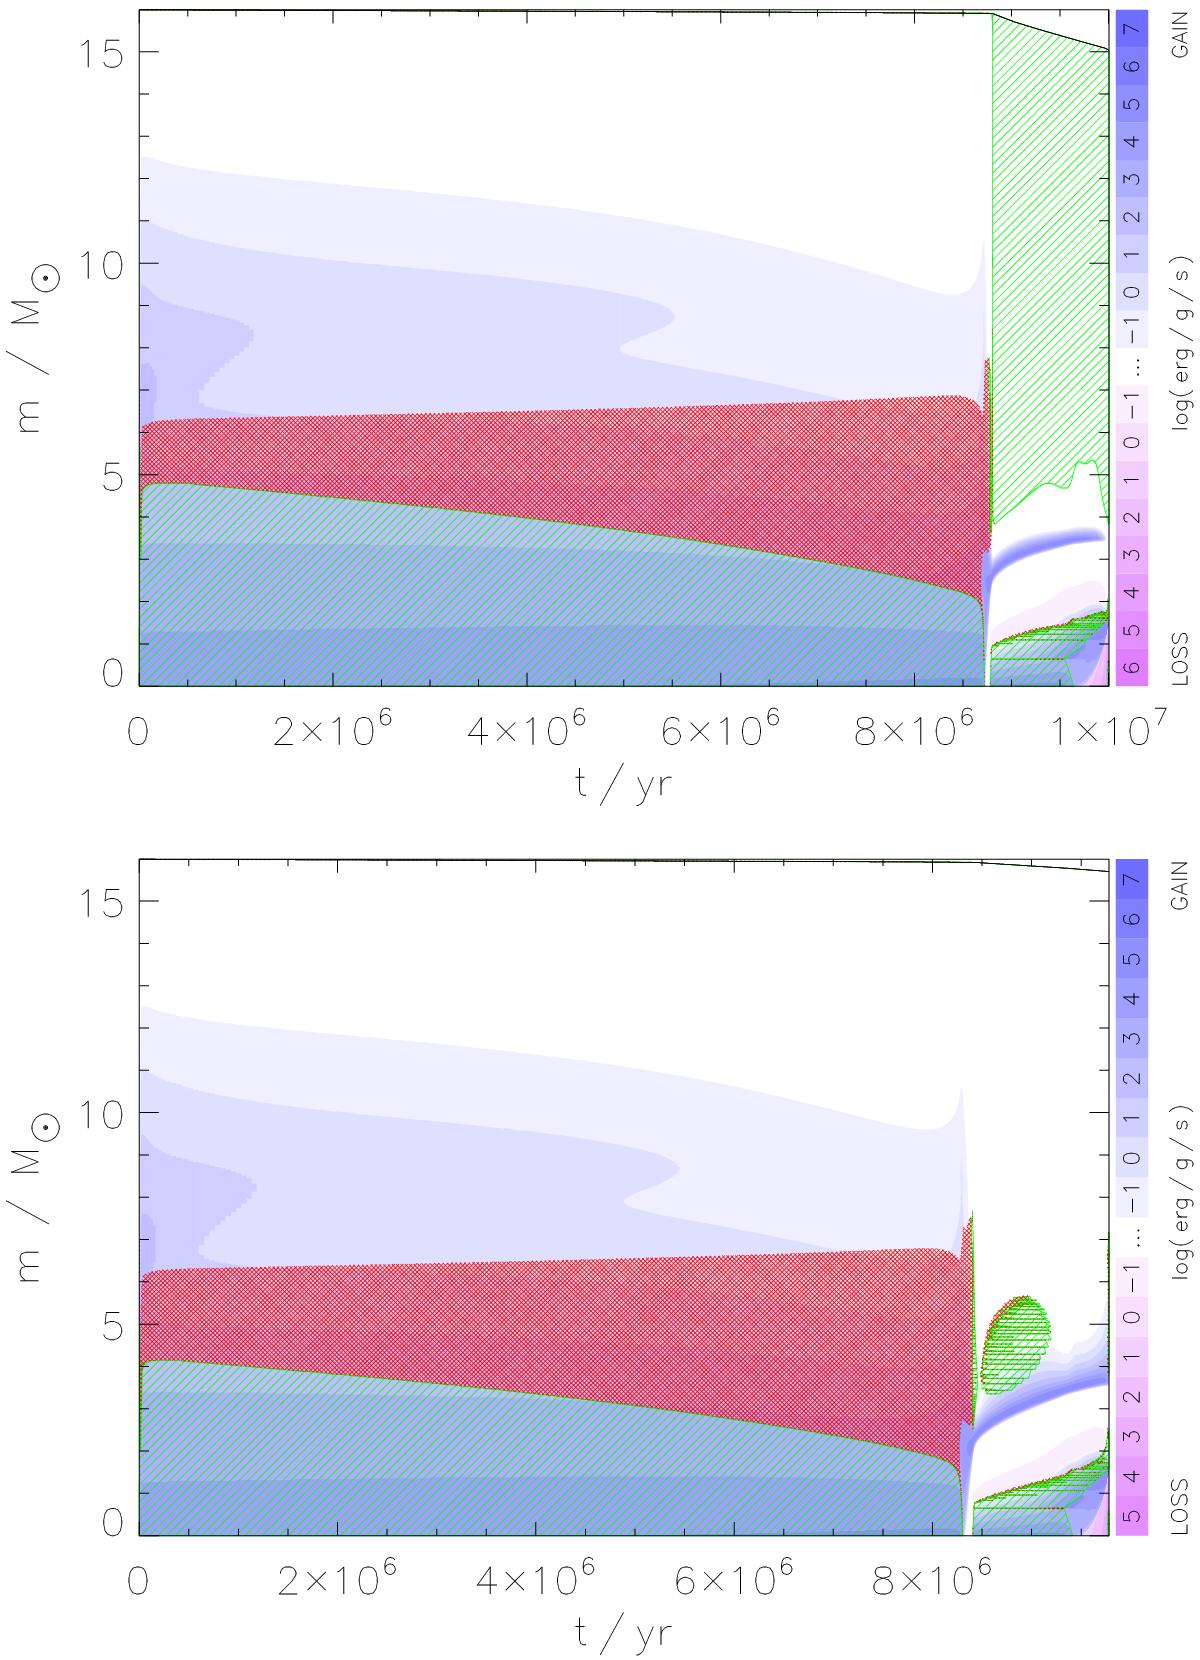
Kippenhahn diagrams of two 16 M⊙ models computed with a convective core reduction parameter of f = 1.12 (top) and f = 1.20 (bottom). Convective (green) and semiconvective (red) regions are shown as a function of mass coordinate and time. Thermonuclear energy generation or loss is colour-coded as shown on the scale on the right-hand side. The evolutionary tracks of both models in the HR diagram are shown in Fig. 2.
Current usage metrics show cumulative count of Article Views (full-text article views including HTML views, PDF and ePub downloads, according to the available data) and Abstracts Views on Vision4Press platform.
Data correspond to usage on the plateform after 2015. The current usage metrics is available 48-96 hours after online publication and is updated daily on week days.
Initial download of the metrics may take a while.