Fig. 3
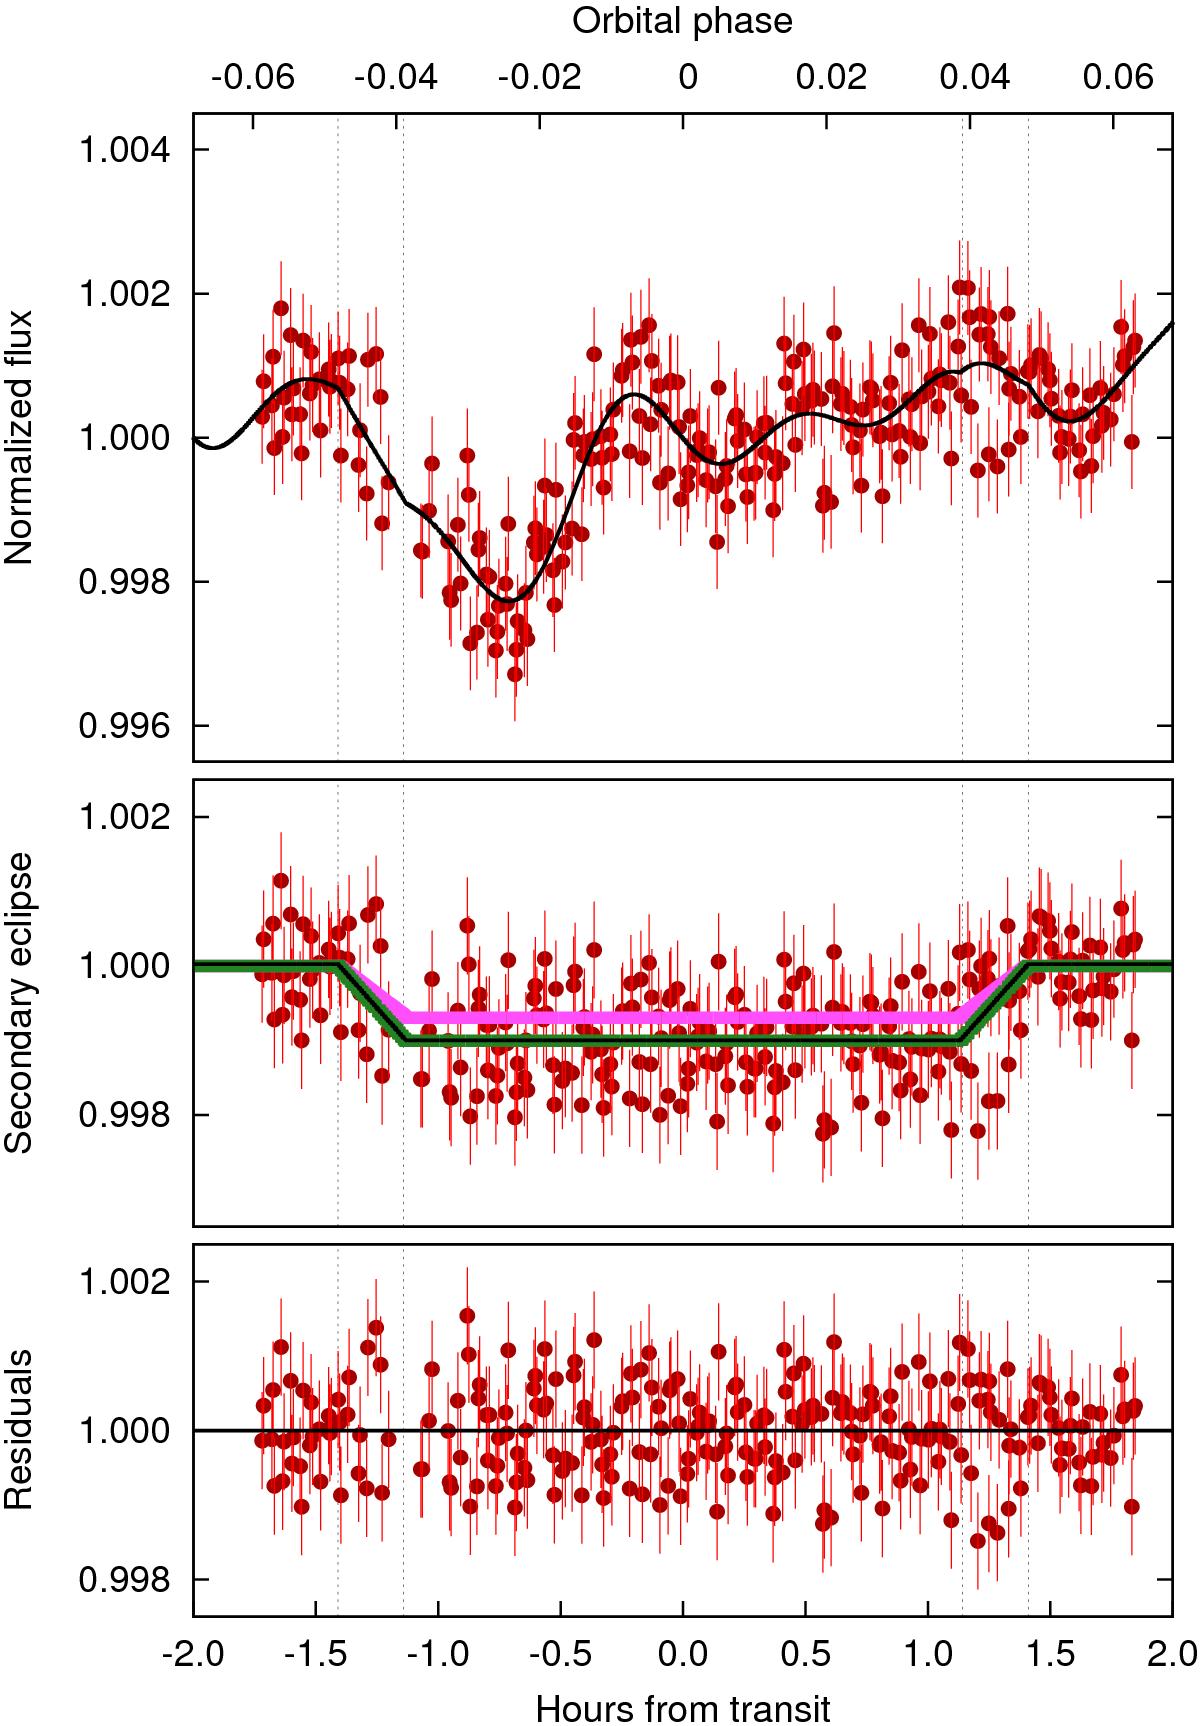
Equivalently to Fig. 1, but around 1.05 μm. From top to bottom, WASP-33’s pulsations and secondary eclipse, the secondary eclipse once the pulsations have been removed, and the residual light curve once the secondary eclipse is removed. Black continuous lines show best-fit models for the pulsations and the secondary eclipse. Pink and green eclipse models correspond to Deming et al. (2012)’s predicted eclipse depths for inverted and non-inverted atmospheric structures integrated in the Y-band.
Current usage metrics show cumulative count of Article Views (full-text article views including HTML views, PDF and ePub downloads, according to the available data) and Abstracts Views on Vision4Press platform.
Data correspond to usage on the plateform after 2015. The current usage metrics is available 48-96 hours after online publication and is updated daily on week days.
Initial download of the metrics may take a while.