Free Access
Fig. 2
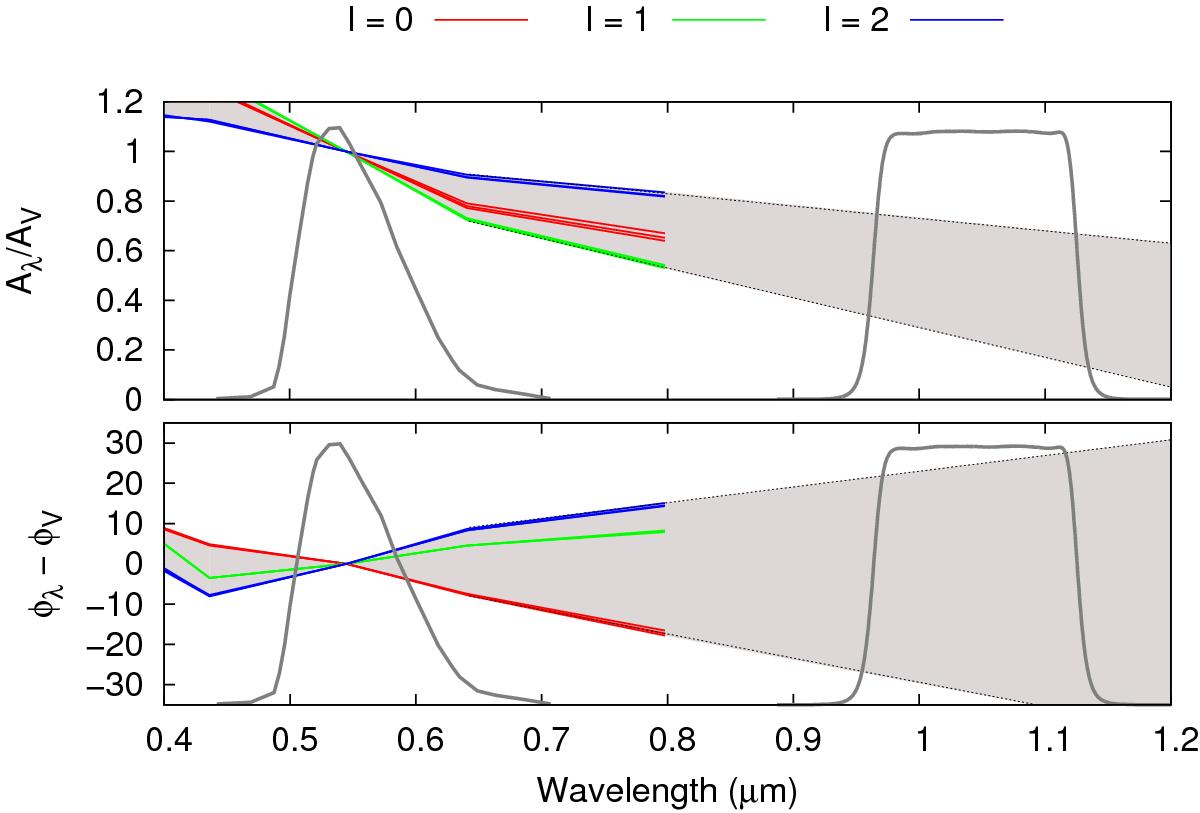
Amplitude ratios (top) and phase differences bottom obtained with FAMIAS for the ν1 = 20.1621 c/d pulsation frequency, considering ℓ ≤ 2. Gray contours indicate the extrapolated area extended to the Y filter. Both V and Y filter transmission functions are plotted in gray continuous lines.
Current usage metrics show cumulative count of Article Views (full-text article views including HTML views, PDF and ePub downloads, according to the available data) and Abstracts Views on Vision4Press platform.
Data correspond to usage on the plateform after 2015. The current usage metrics is available 48-96 hours after online publication and is updated daily on week days.
Initial download of the metrics may take a while.