Fig. 4
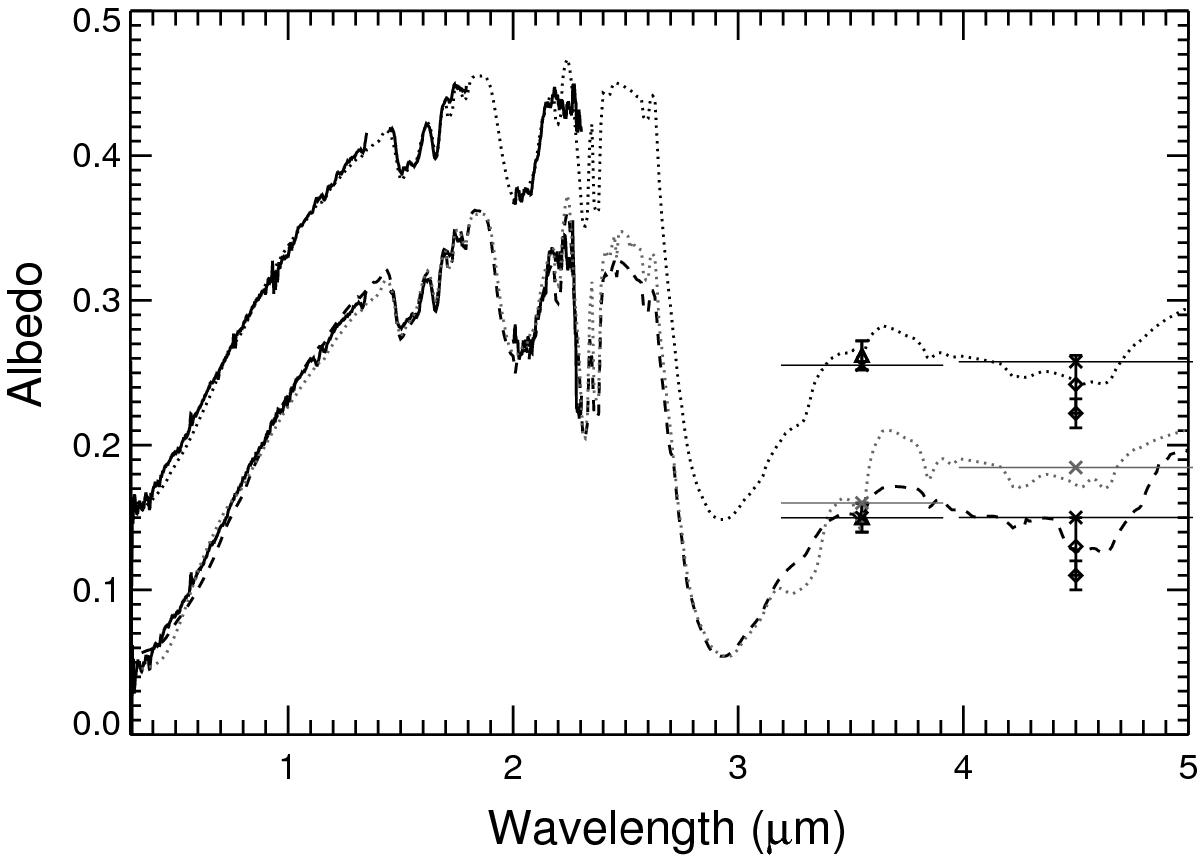
Bottom spectrum: (50000) Quaoar (Q2, solid line) with Spitzer photometry data (triangle and diamond symbols) obtained at two different epochs plotted with the corresponding best-fitting spectral model (dashed line, parameters are listed in Table 3, column Spitzer) that includes CO diluted in N2 and CO2. The best-fitting model for the spectral dataset without CO and CO2 is also overlapped and shown for comparison (grey dotted line, parameters are listed in Table 3, column Q2). Both models, convolved by the Spitzer IRAC filter bandpasses (horizontal segments), are shown as crosses (black and grey, respectively). Top spectrum: (50000) Quaoar (Q4, solid line) and corresponding best-fitting spectral model (dotted line, parameters are listed in Table 3, column Q4). The model, convolved by the Spitzer IRAC filter bandpasses (horizontal segments), is shown as black crosses. The top spectrum has been shifted by +0.1 units for clarity.
Current usage metrics show cumulative count of Article Views (full-text article views including HTML views, PDF and ePub downloads, according to the available data) and Abstracts Views on Vision4Press platform.
Data correspond to usage on the plateform after 2015. The current usage metrics is available 48-96 hours after online publication and is updated daily on week days.
Initial download of the metrics may take a while.