Free Access
Fig. 3
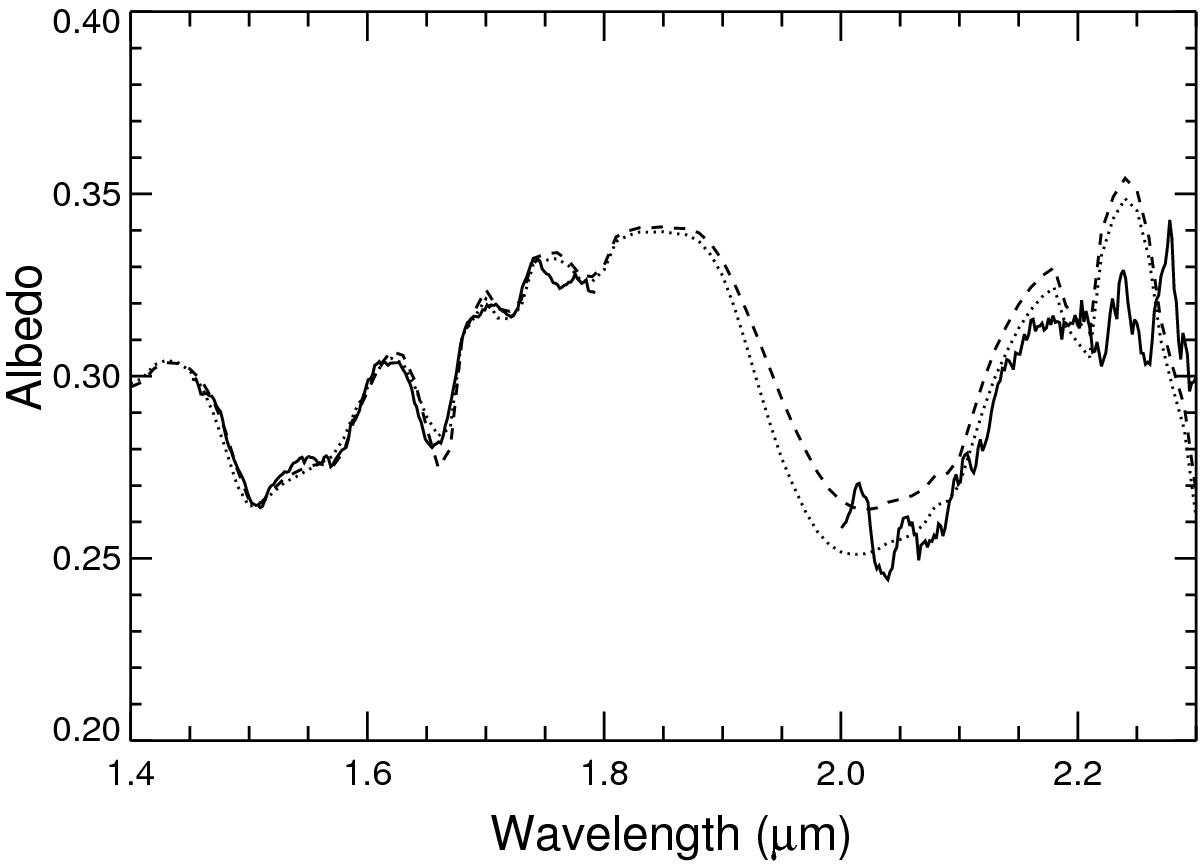
Spectrum zoom of (50000) Quaoar (Q1, solid line) and corresponding best-fitting spectral model (dotted line, described in Table 3) and equivalent model calculated without NH3·H2O (dashed line). The lack of NH3·H2O prevents the model from properly fitting the bottom of the 2-μm band.
Current usage metrics show cumulative count of Article Views (full-text article views including HTML views, PDF and ePub downloads, according to the available data) and Abstracts Views on Vision4Press platform.
Data correspond to usage on the plateform after 2015. The current usage metrics is available 48-96 hours after online publication and is updated daily on week days.
Initial download of the metrics may take a while.