Fig. 1
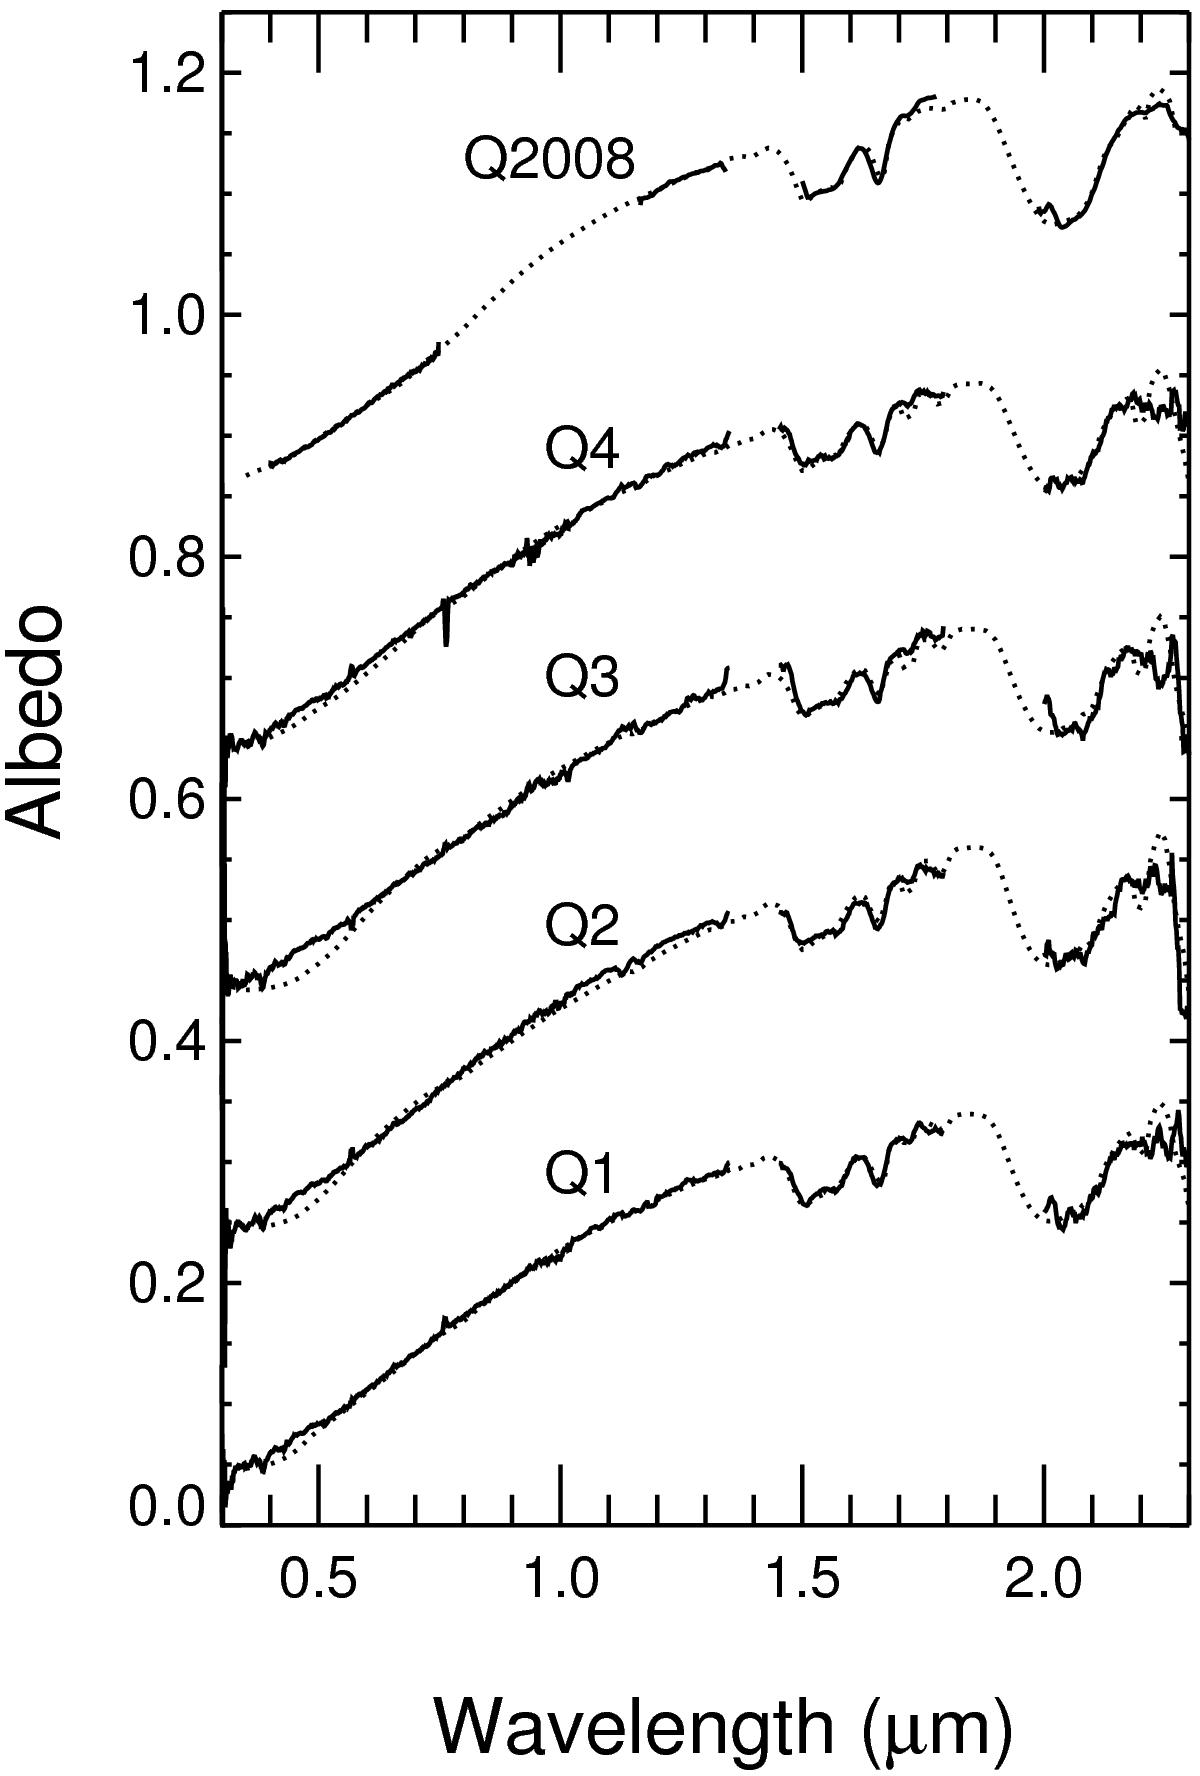
Five spectra of (50000) Quaoar (solid lines) with their corresponding spectral models (dotted lines) calculated for the spectral region shown and giving most weight to the H-band. Spectra labelled Q1 through Q4 are newly obtained (observing circumstances are reported in Table 1), while Q2008 is the spectrum analysed in Dalle Ore et al. (2009). The spectra are represented in albedo using the value reported by Fornasier et al. (2013) with the correction as described in Sect. 3. The top four spectra have been shifted by +0.2, +0.4, +0.6, and +0.8 units for clarity.
Current usage metrics show cumulative count of Article Views (full-text article views including HTML views, PDF and ePub downloads, according to the available data) and Abstracts Views on Vision4Press platform.
Data correspond to usage on the plateform after 2015. The current usage metrics is available 48-96 hours after online publication and is updated daily on week days.
Initial download of the metrics may take a while.