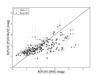
Fig. 8
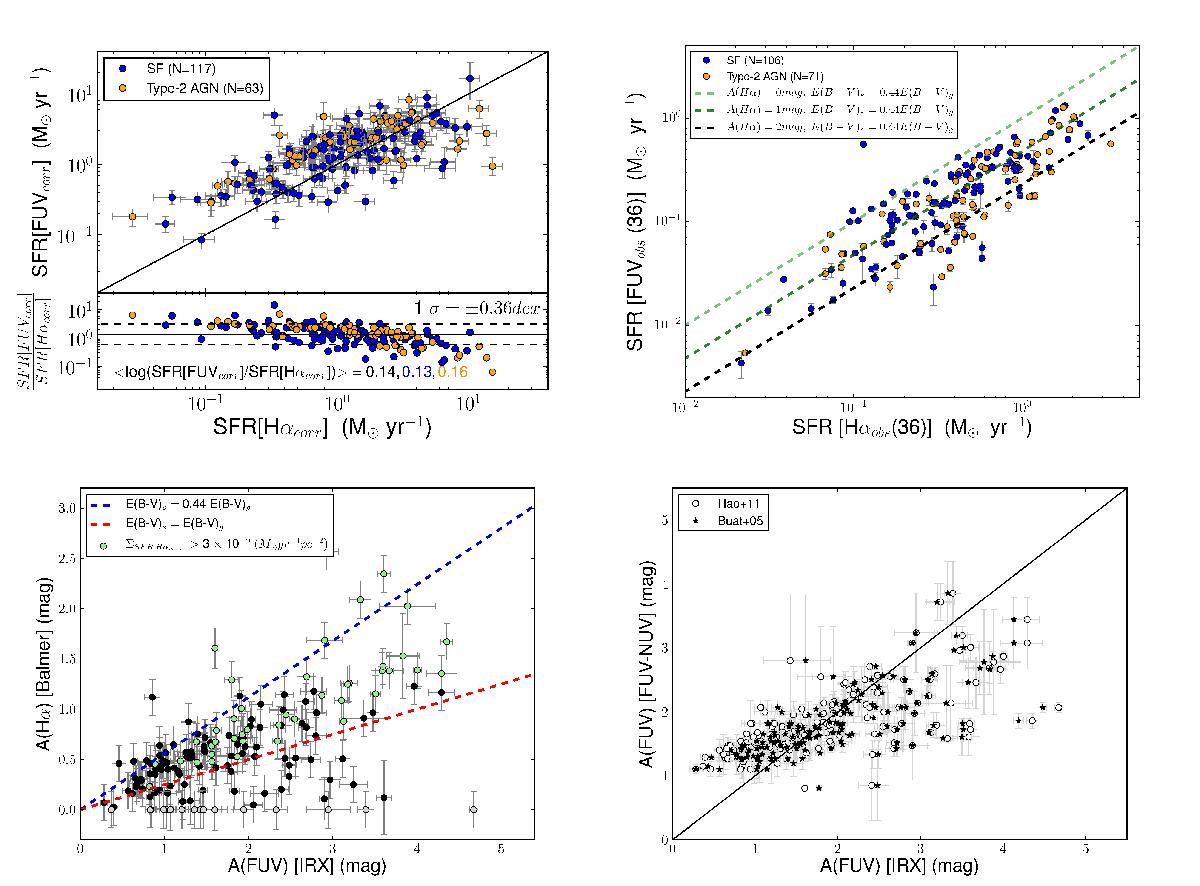
Top left panel: FUV-corrected SFR as a function of Balmer-corrected Hα SFR, using Eqs. (3) and (4), respectively. Color-coding, solid, and dashed lines have the same meaning as in Fig. 7. At high L(Hα)corr the SFR derived from the UV alone is underestimated. It might be that the extinction correction using the FUV−NUV color traces only the most superficial and less extinct part of the SFR. Consequently, the higher SFRs associated with higher values of the extinction are being underestimated. Top right panel: relation between observed-FUV SFR and observed-Hα SFR. Light green, dark green, and black dashed lines correspond to values of A(Hα) equal to 0, 1, and 2 mag, respectively. All cases are based on the assumption that the relation between the color excess of the stars and the gas is E(B−V)s = 0.44E(B−V)g. Bottom left panel: comparison between A(Hα) from the Balmer decrement (Eq. (1)) and A(FUV) from IR/FUV flux ratio using the expression by Hao et al. (2011). Blue dashed line represents a relation between color excess of E(B−V)s = 0.44E(B−V)g while red dashed line assumes that the relation is E(B−V)s = E(B−V)g. Gray points show cases of A(Hα) equal to zero magnitudes, while light green points show galaxies with the highest values of the SFR surface density. This plot suggest that we might apply a higher value for the relation between the color excess of the gas and the stellar continuum than that found by Calzetti et al. (2000) for our sample, although galaxies with higher values of the SFR surface density are more similar to this previous relation. Bottom right panel: comparison between A(FUV) derived using the FUV−NUV color (Eq. (2)) and A(FUV) from IR/FUV flux ratio. A discrepancy between these two expressions is found for the lowest and highest values of the attenuation. Star-like symbols show the values when the expression used to compute the A(FUV) is that from Buat et al. (2005), while open circles show the values from Hao et al. (2011). The solid line shows the 1:1 line for reference.
Current usage metrics show cumulative count of Article Views (full-text article views including HTML views, PDF and ePub downloads, according to the available data) and Abstracts Views on Vision4Press platform.
Data correspond to usage on the plateform after 2015. The current usage metrics is available 48-96 hours after online publication and is updated daily on week days.
Initial download of the metrics may take a while.