Fig. 7
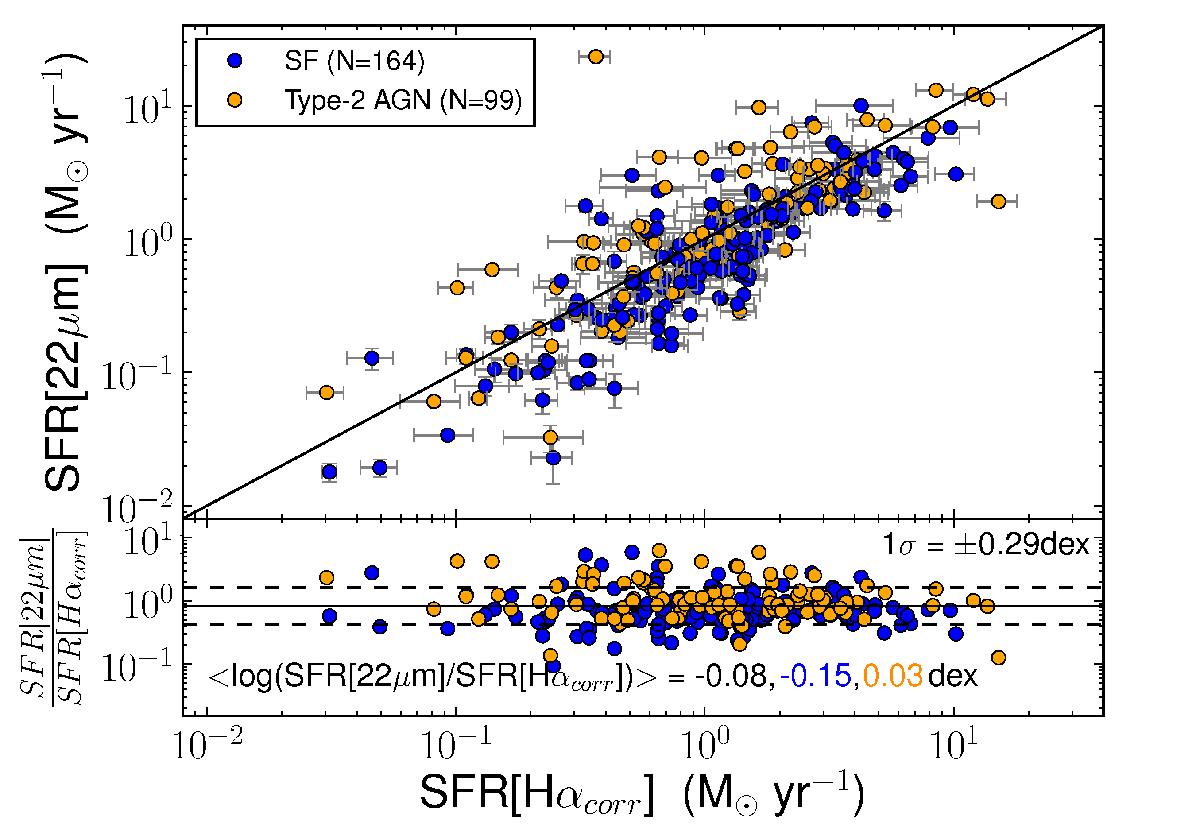
Comparison between the MIR (22 μm) and the Balmer-corrected Hα SFR tracers; recipes from Calzetti (2013); see Eqs. (6) and (4). Solid line corresponds to the 1:1 line. Orange points show type-2 AGN galaxies and blue points represent star-forming galaxies. The legend gives the number of objects available in both cases. Residuals appear in the bottom part of this figure as a function of the Balmer-corrected Hα SFR tracer. Solid line shows the mean value of −0.08 when all the galaxies are included and the dashed lines are referred to the 1σ dispersion (±0.29 dex) around it. For SF galaxies, the mean values is −0.15, while for type-2 AGN host galaxies is 0.03.
Current usage metrics show cumulative count of Article Views (full-text article views including HTML views, PDF and ePub downloads, according to the available data) and Abstracts Views on Vision4Press platform.
Data correspond to usage on the plateform after 2015. The current usage metrics is available 48-96 hours after online publication and is updated daily on week days.
Initial download of the metrics may take a while.