Fig. 6
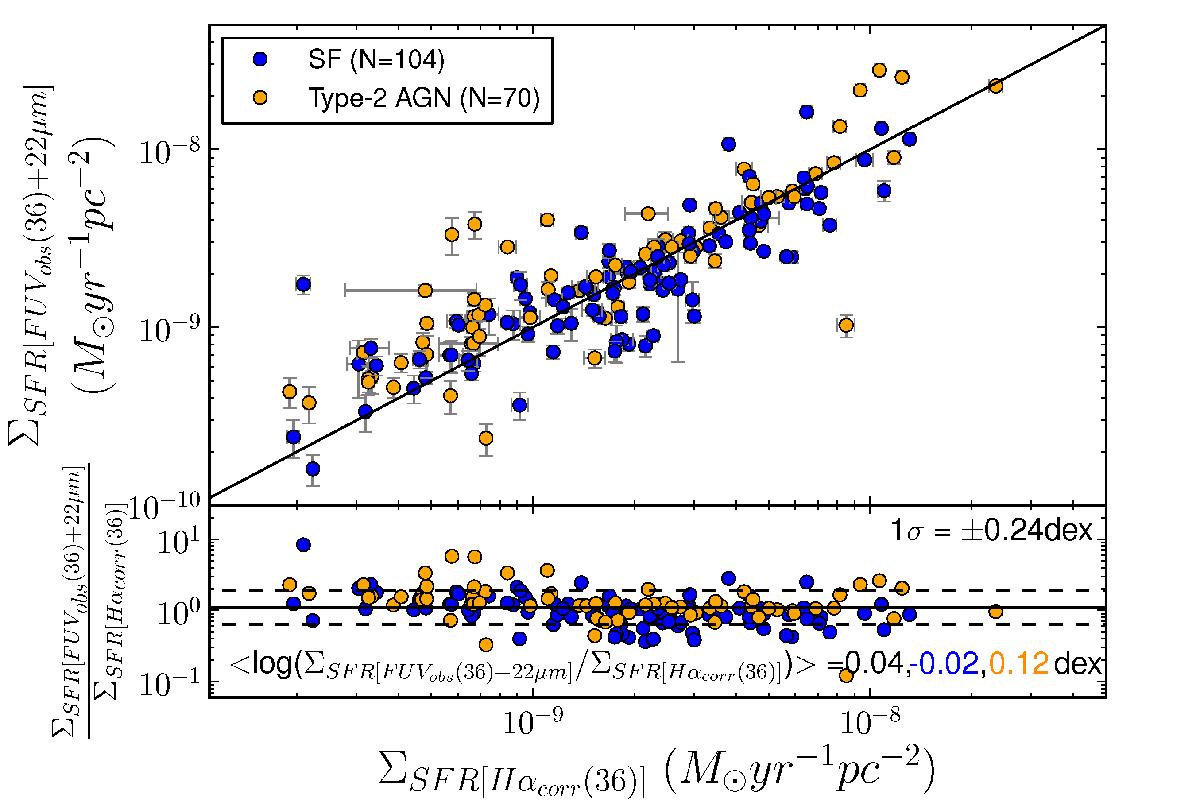
Star formation rate surface density derived using a combination of observed-FUV and 22 μm luminosities compared to Balmer attenuation-corrected Hα star formation rate surface density. The values are obtained within an area of semimajor axis equal to 36 arcsec. The solid line corresponds to equal ΣSFR on both axes. The bottom part of this plot represents the residuals as a function of the Balmer-corrected Hα star formation rate surface density. The mean value is shown with the solid line, while dashed lines correspond to the 1σ dispersion in dex around the mean value. Black, blue, and orange numbers correspond to the mean values for the whole sample, SF, and type-2 AGN host galaxies, respectively. The tight relation found for these two SFR density tracers shows that there are not systematic differences between them, hence, we can safely use the SFR measurements.
Current usage metrics show cumulative count of Article Views (full-text article views including HTML views, PDF and ePub downloads, according to the available data) and Abstracts Views on Vision4Press platform.
Data correspond to usage on the plateform after 2015. The current usage metrics is available 48-96 hours after online publication and is updated daily on week days.
Initial download of the metrics may take a while.