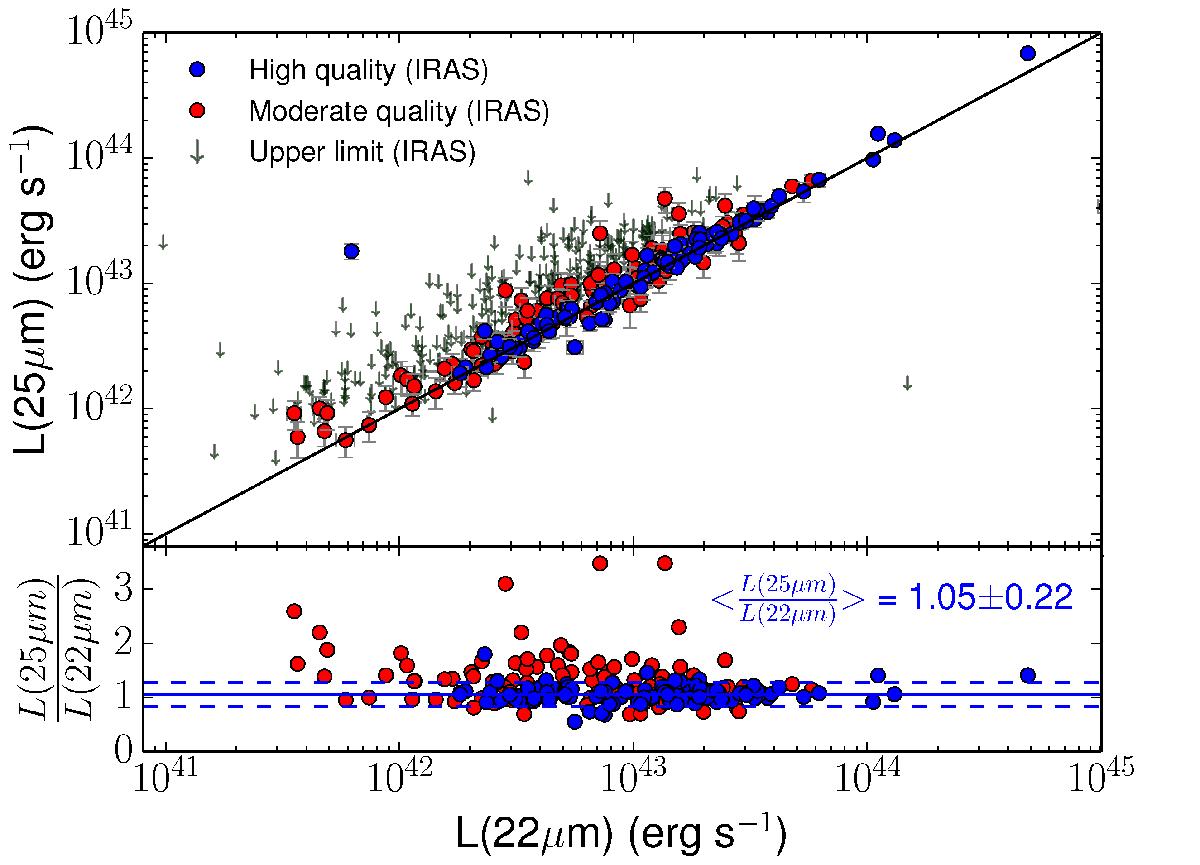
Fig. 5

Comparison between 22 μm WISE and 25 μm IRAS luminosities for the CALIFA mother sample. Blue and red points correspond to high and moderate quality IRAS 25 μm data, respectively. Arrows represent upper limits for the same IRAS band. The solid line shows a linear 1:1 relation for reference. The average ratio between 25 μm and 22 μm luminosities is 1.05 ± 0.22 when using high quality 25 μm IRAS measurements. This tight relation allows us to use them interchangeably using the previous conversion factor.
Current usage metrics show cumulative count of Article Views (full-text article views including HTML views, PDF and ePub downloads, according to the available data) and Abstracts Views on Vision4Press platform.
Data correspond to usage on the plateform after 2015. The current usage metrics is available 48-96 hours after online publication and is updated daily on week days.
Initial download of the metrics may take a while.


