Fig. 22
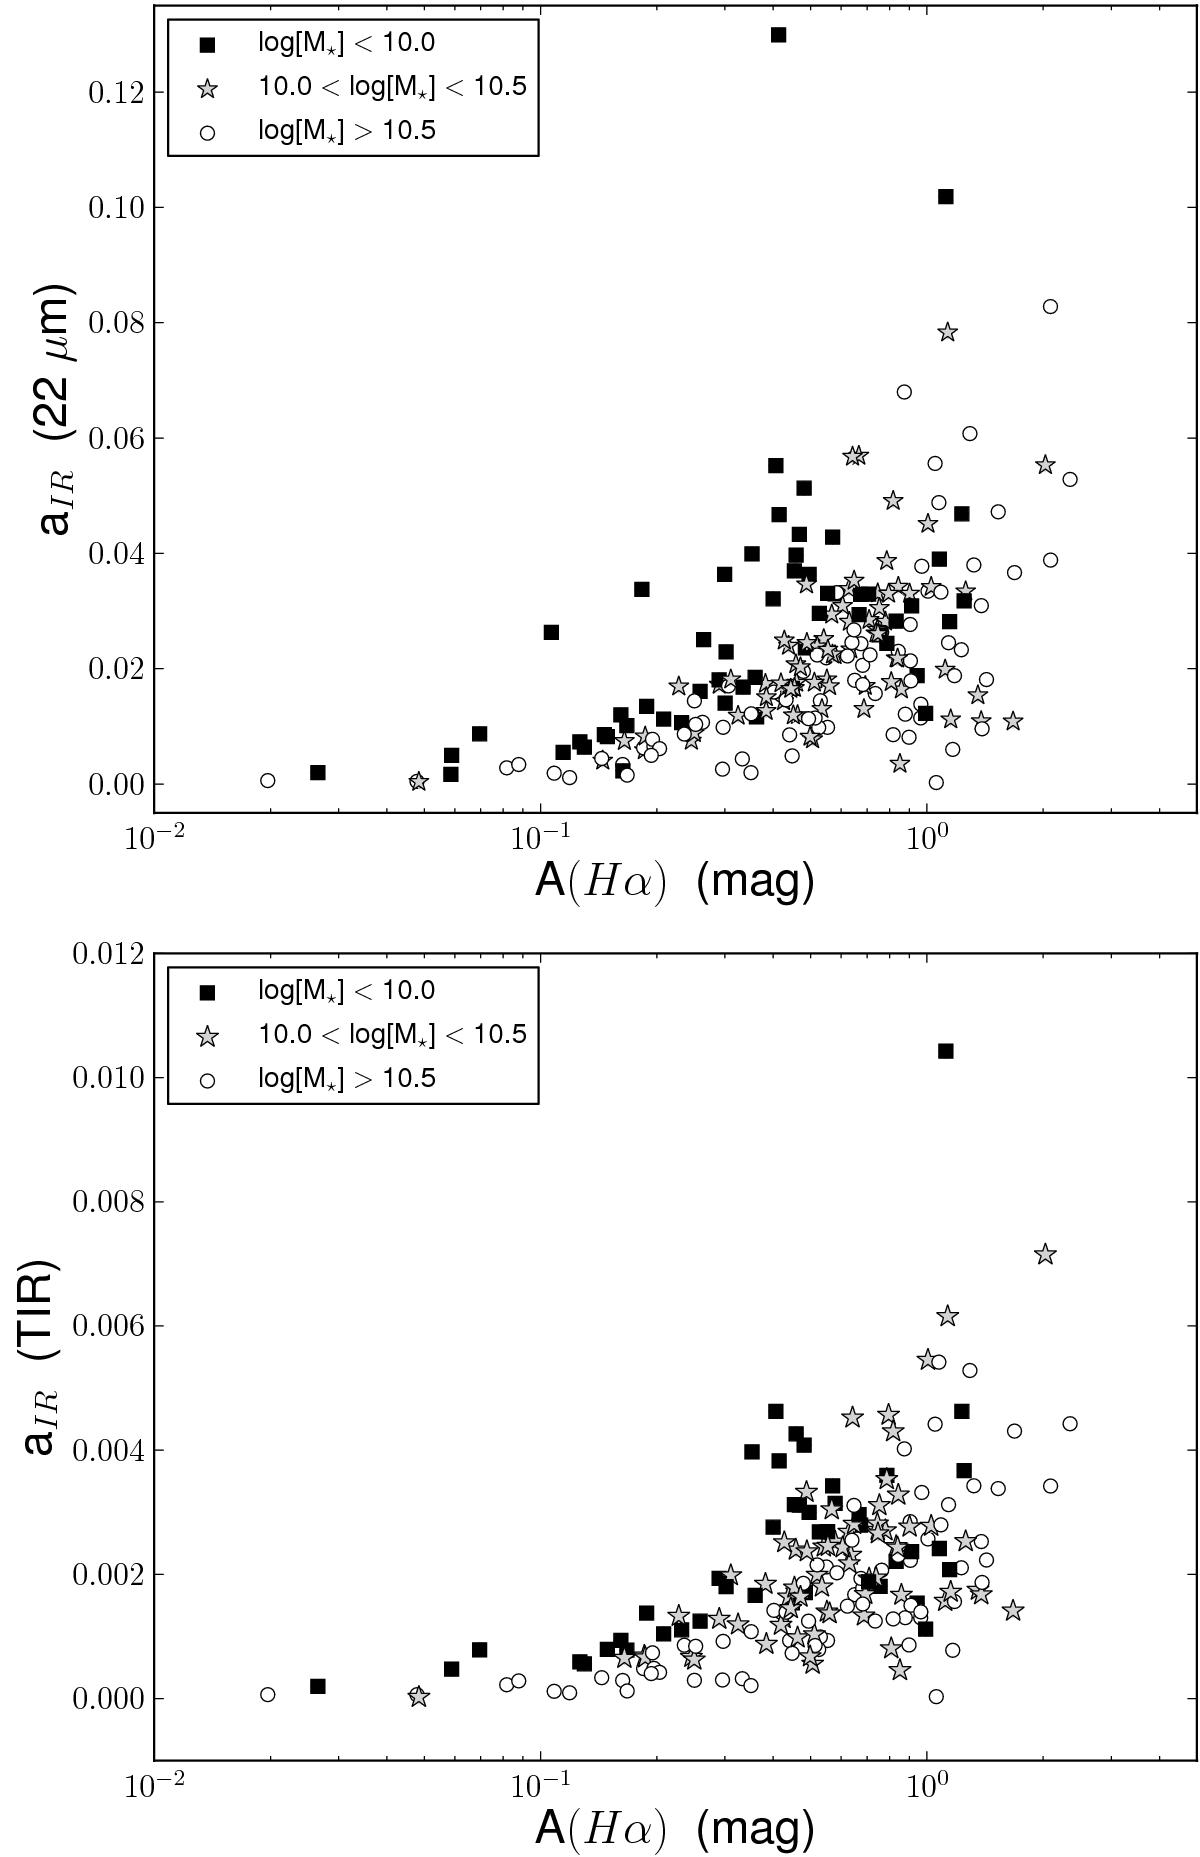
Top panel: variation of the aIR coefficient with the Hα attenuation derived using the Balmer decrement for the Hα+22 μm hybrid tracer. Black squares show galaxies with stellar masses lower than log[M⋆] < 10.0; gray stars represent galaxies with stellar masses in the range of 10.0 < log[M⋆] < 10.5; and finally, open circles are for the most massive galaxies with log[M⋆] > 10.5. Bottom panel: same as previous panel, except this time for the aIR coefficient, which corresponds to the Hα+TIR hybrid tracer.
Current usage metrics show cumulative count of Article Views (full-text article views including HTML views, PDF and ePub downloads, according to the available data) and Abstracts Views on Vision4Press platform.
Data correspond to usage on the plateform after 2015. The current usage metrics is available 48-96 hours after online publication and is updated daily on week days.
Initial download of the metrics may take a while.