Fig. 20
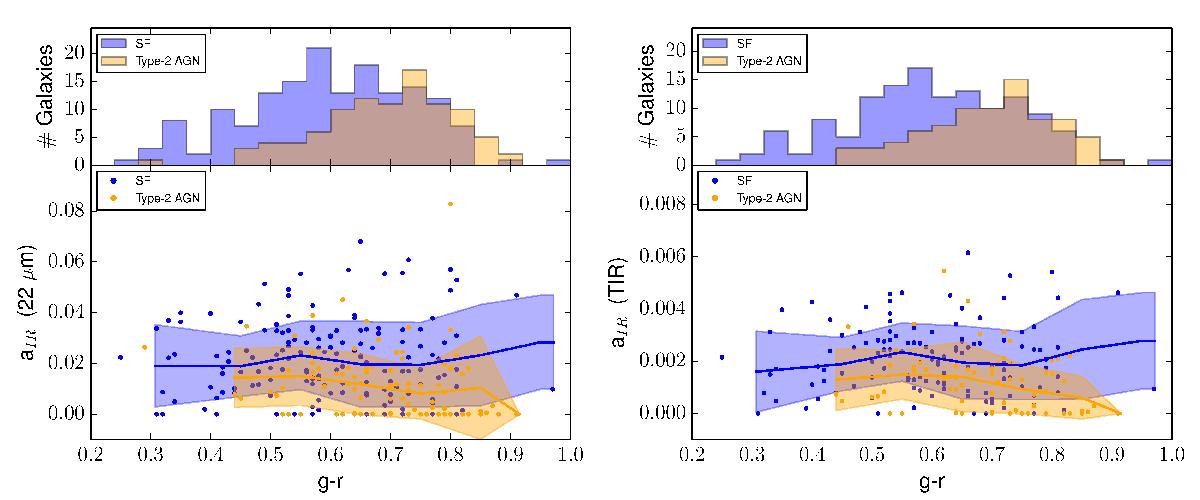
Left panel: distribution of aIR coefficients as a function of the galaxies g−r SDSS color for the Hα+22 μm hybrid tracer. Orange points show type-2 AGN galaxies while blue points represent star-forming galaxies. Filled contours represent the 1σ dispersion after applying a 5σ rejection around the mean value expressed as a blue (orange) solid line for the SF (type-2 AGN) galaxies. The corresponding histogram with the distribution of the number of galaxies for each g−r SDSS color is plotted on the top for reference applying the same color-coding. Right panel: same as the left panel, except showing the Hα+TIR hybrid tracer. There is a clear offset between the star-forming and type-2 AGN host galaxies with the aIR coefficient at any g−r SDSS color.
Current usage metrics show cumulative count of Article Views (full-text article views including HTML views, PDF and ePub downloads, according to the available data) and Abstracts Views on Vision4Press platform.
Data correspond to usage on the plateform after 2015. The current usage metrics is available 48-96 hours after online publication and is updated daily on week days.
Initial download of the metrics may take a while.