Fig. 2
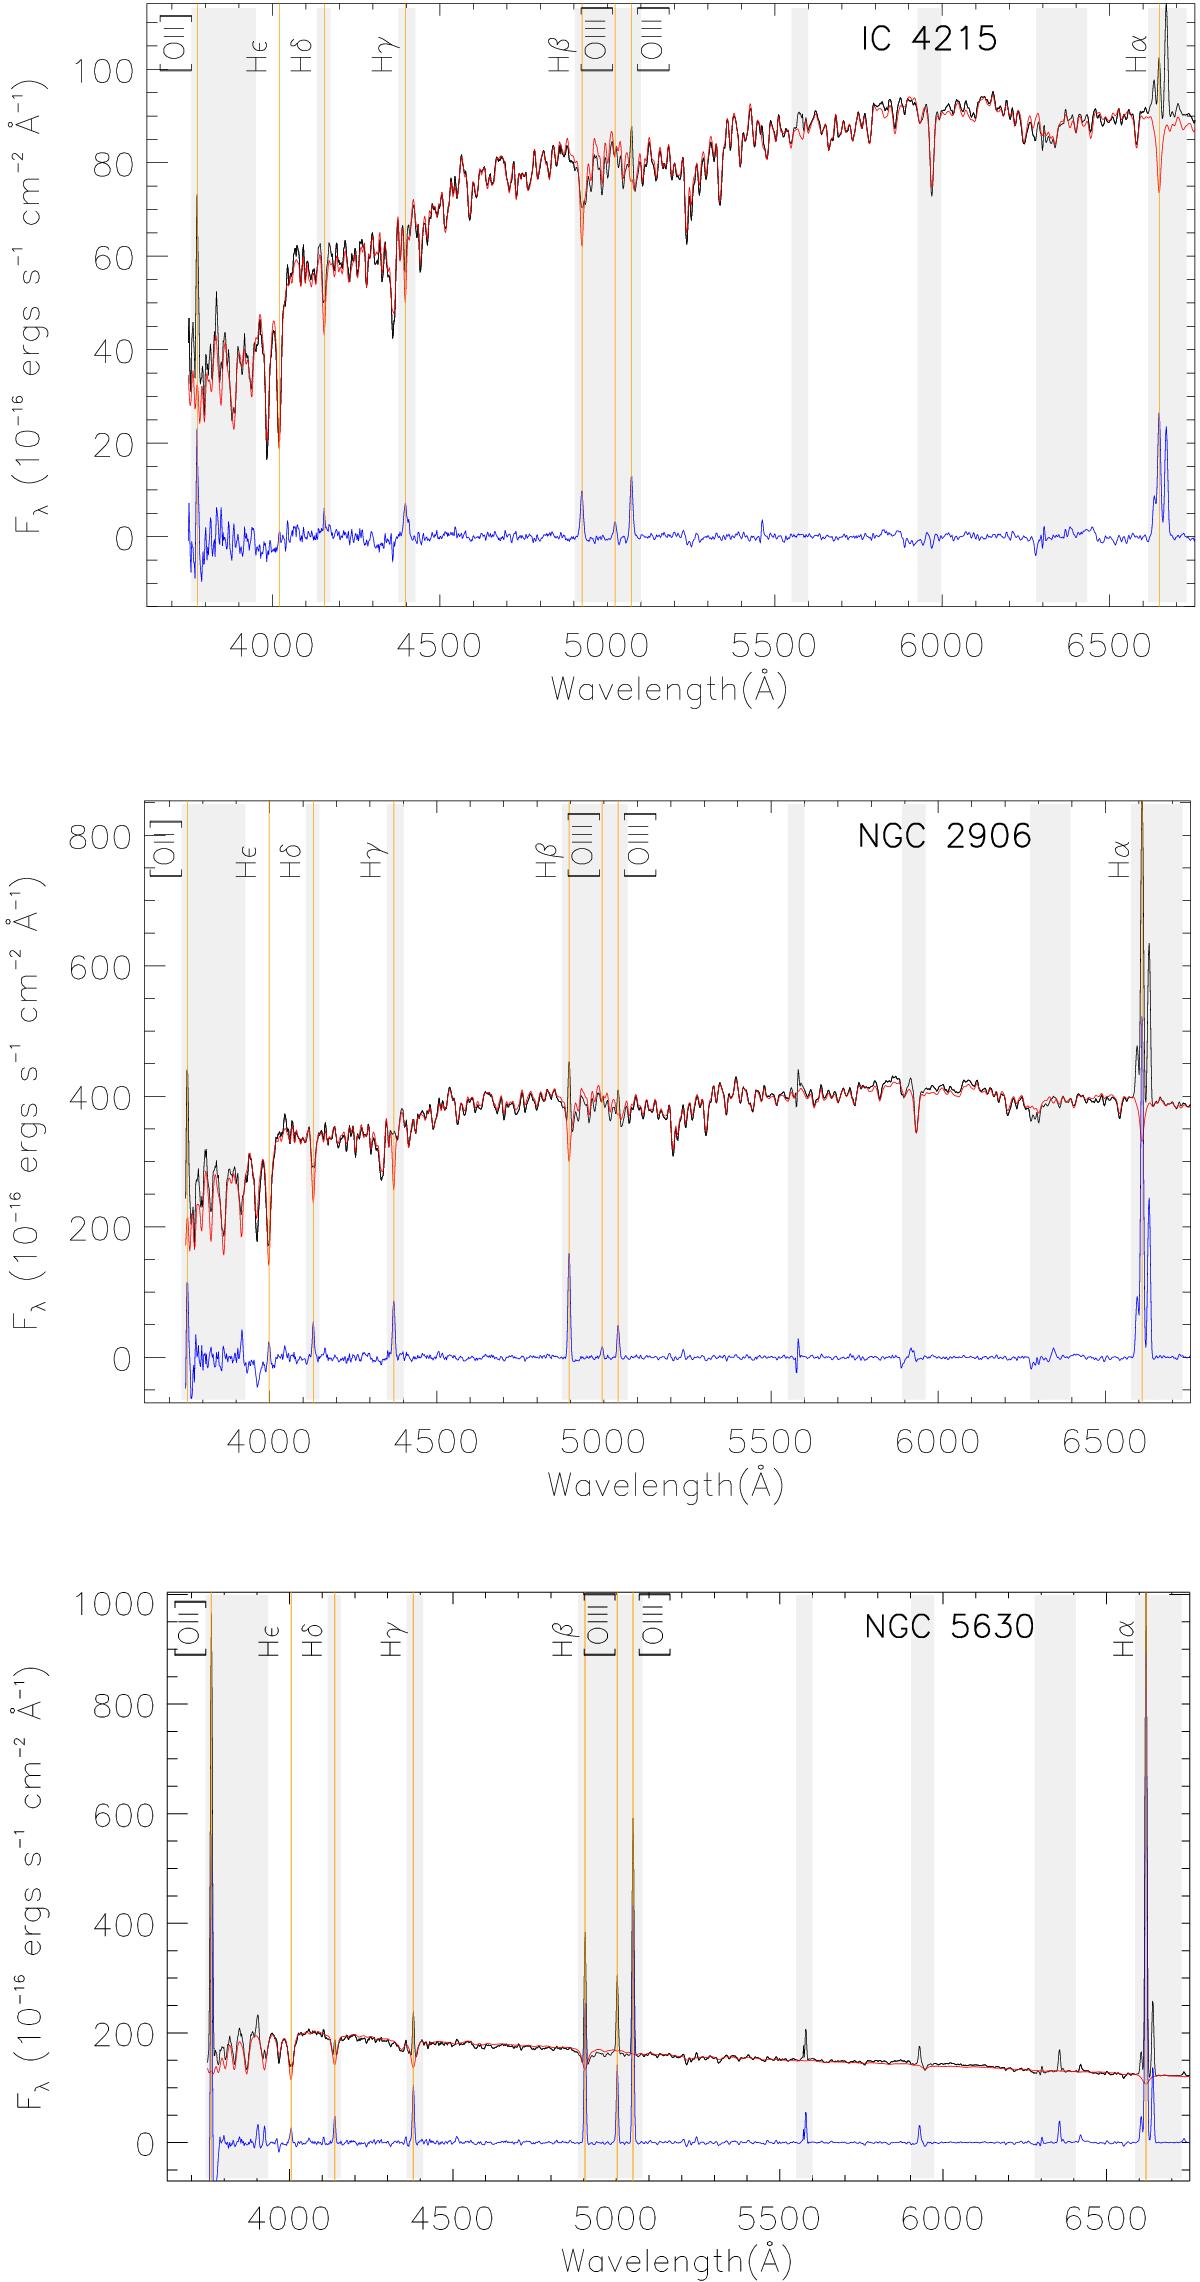
Top panel: original integrated spectrum for galaxy IC 4215 is shown in black, the best fit to the stellar population appears in red (using the 3745−7500 Å entire spectral range), and pure emission line spectrum (after the subtraction of a residual continuum shape applying a smooth function). This galaxy shows a small equivalent width in the Hβ line. Center panel: same as top panel for the galaxy NGC 2906. Note that in this case the spectrum shows more prominent Hα and Hβ emission lines. Bottom panel: in this case, NGC 5630 shows a typical emission line dominated spectrum with very high EWs of Hα and Hβ emission lines. These spectra show the variety in levels of emission line strength in our galaxies. A proper subtraction of the underlying stellar population is required to obtain the estimation of the emission line fluxes.
Current usage metrics show cumulative count of Article Views (full-text article views including HTML views, PDF and ePub downloads, according to the available data) and Abstracts Views on Vision4Press platform.
Data correspond to usage on the plateform after 2015. The current usage metrics is available 48-96 hours after online publication and is updated daily on week days.
Initial download of the metrics may take a while.