Fig. 19
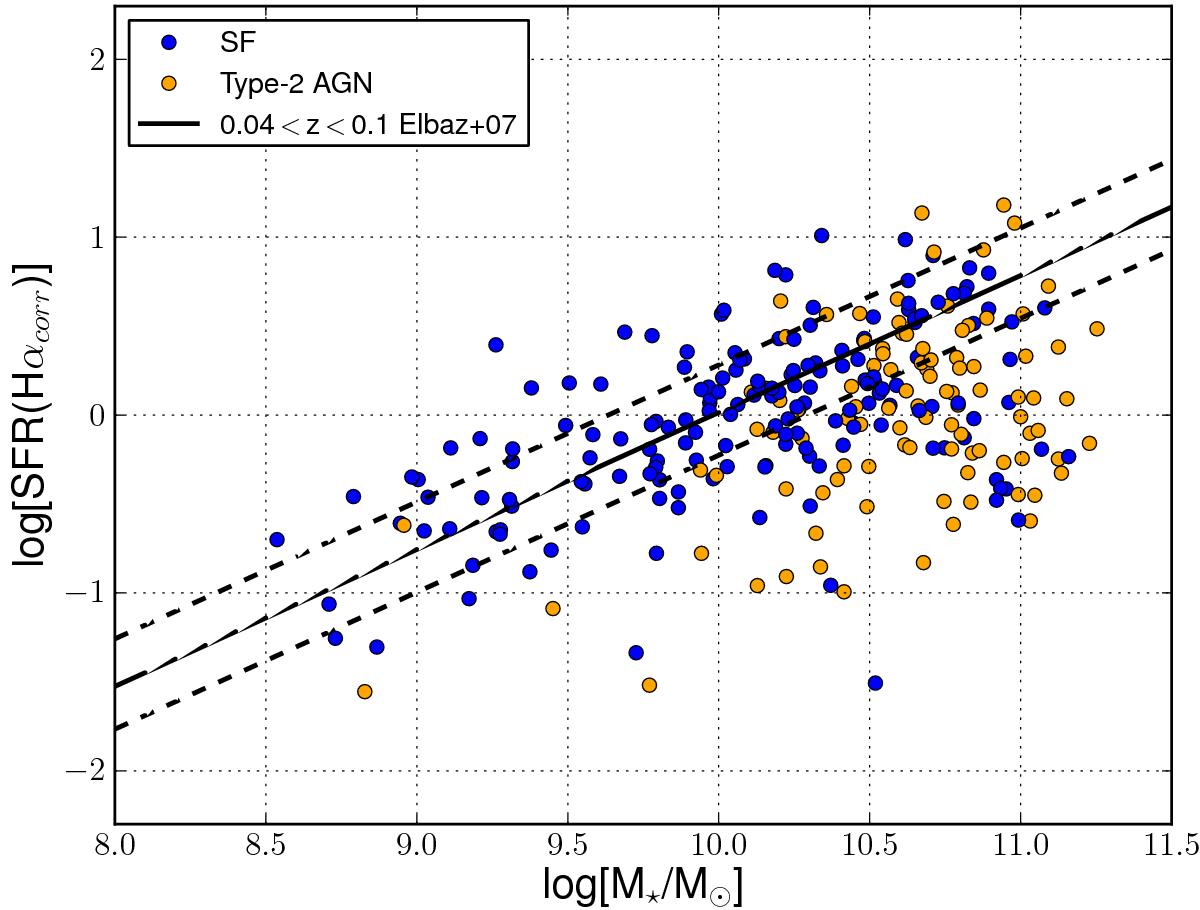
Correlation between the extinction-corrected Hα SFR and the total stellar mass of the galaxies. Solid line represents the fit of Elbaz et al. (2007) with a slope of 0.77 for galaxies in the 0.04 <z< 0.1 range, while dashed lines correspond to the dispersion of this fit. Type-2 AGN host galaxies dominate the high-mass end in the main sequence plot for our galaxies. They show somewhat smaller SFR values for the same stellar mass. This fact could be because of a fraction of Hα emission absorbed by the AGN or in the circumnuclear region or, alternatively, the presence of the type-2 AGN might impact the internal evolution of the galaxy quenching the SF.
Current usage metrics show cumulative count of Article Views (full-text article views including HTML views, PDF and ePub downloads, according to the available data) and Abstracts Views on Vision4Press platform.
Data correspond to usage on the plateform after 2015. The current usage metrics is available 48-96 hours after online publication and is updated daily on week days.
Initial download of the metrics may take a while.