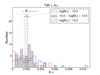
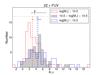
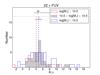
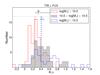
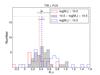
Fig. 18
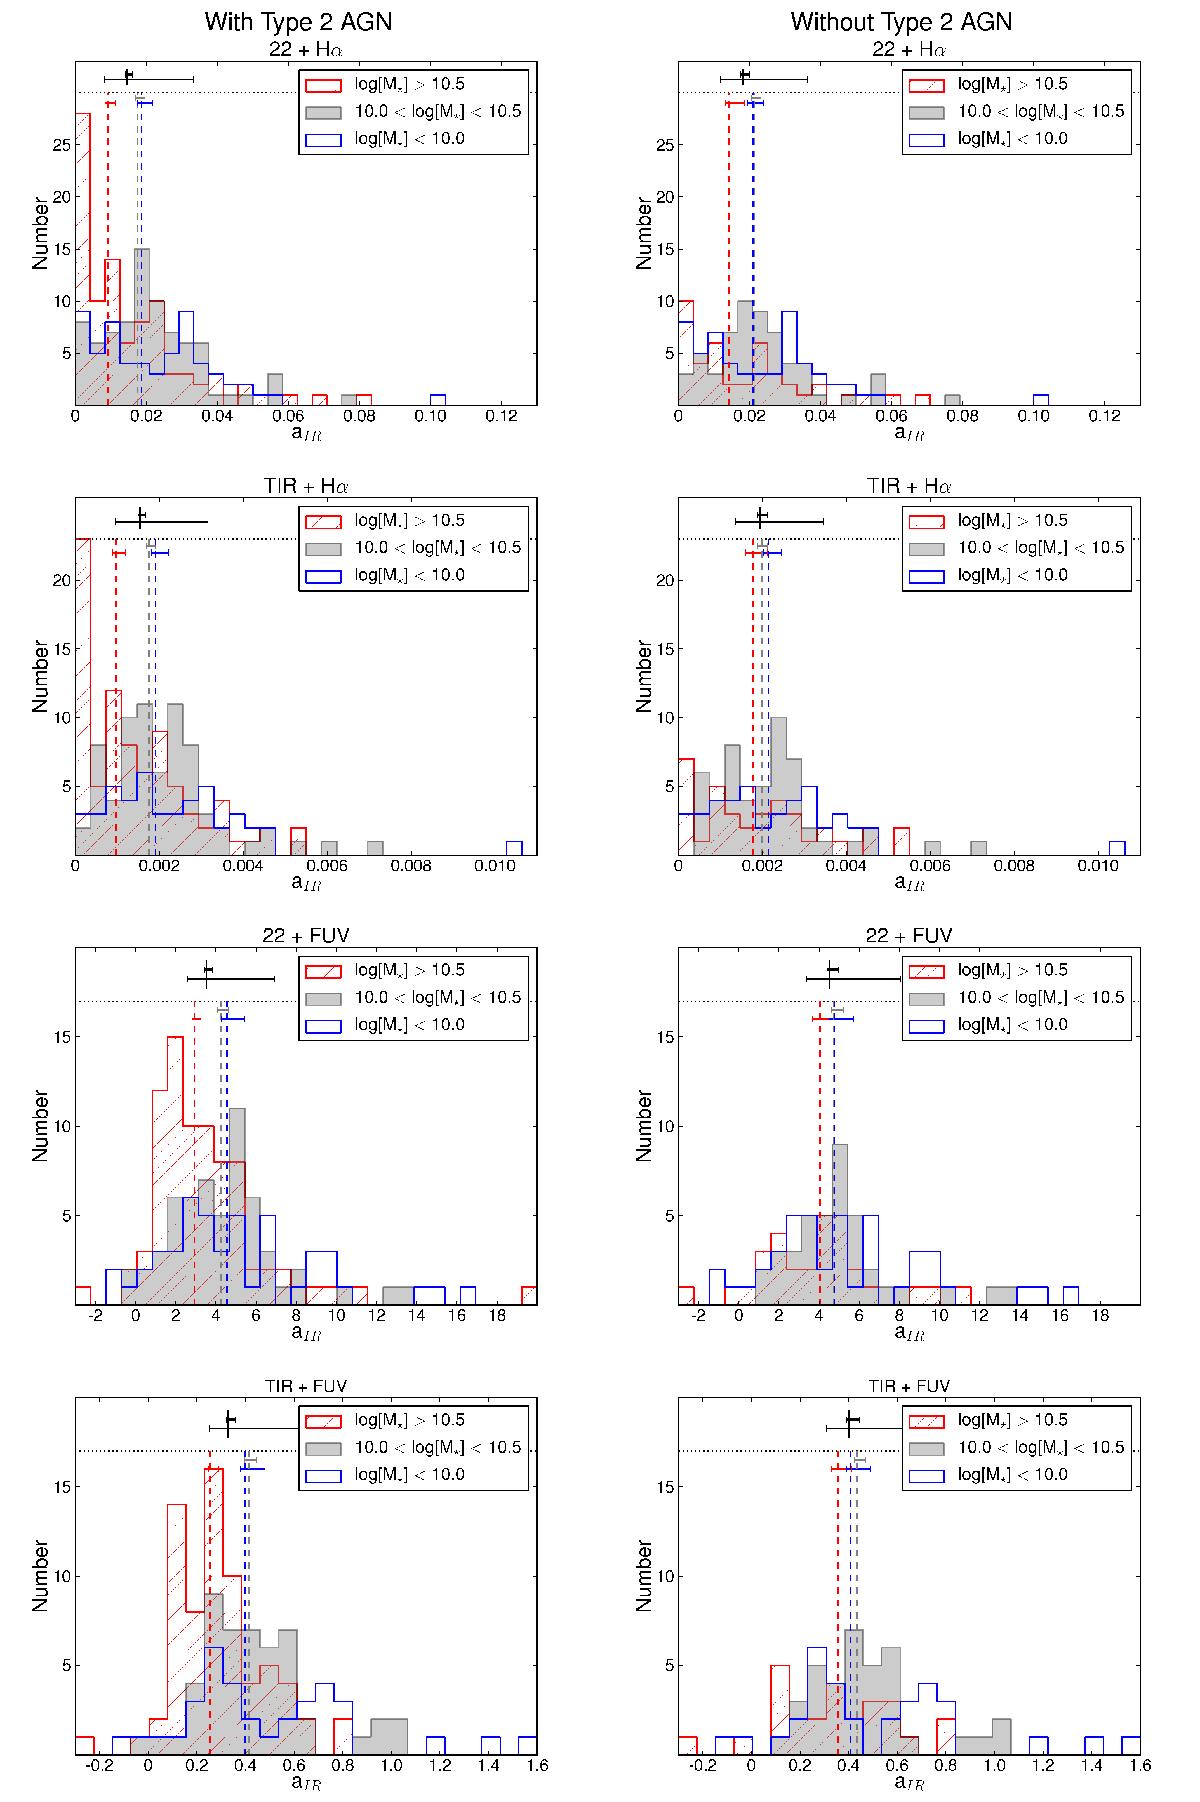
Left four panels: frequency histograms of aIR for different hybrid tracers as a function of stellar mass. Massive galaxies (log[M∗/M⊙] > 10.5) appear in red, intermediate-mass galaxies (10 < log [M∗/M⊙] < 10.5) are shown in gray, and low-mass galaxies (log[M∗/M⊙] < 10) in blue. Dashed vertical lines correspond to the median value of each galaxy group. Black top marks show the median value for all the galaxies as in Fig. 16. There is a clear trend with the stellar mass that less massive galaxies need a higher value of the aIR coefficient compared with massive galaxies. Right four panels: same as in left panels, except this time type-2 AGNs are excluded for the sample. The distribution of the aIR coefficient with the stellar mass and morphological type (Fig. 17) allow us to provide, for the first time, a set of hybrid calibrations in terms of these galaxy properties. If the sample to be analyzed is biased toward morphology or, more commonly, luminosity or stellar mass, these tracers would be particularly useful (see Tables 4 and 5).
Current usage metrics show cumulative count of Article Views (full-text article views including HTML views, PDF and ePub downloads, according to the available data) and Abstracts Views on Vision4Press platform.
Data correspond to usage on the plateform after 2015. The current usage metrics is available 48-96 hours after online publication and is updated daily on week days.
Initial download of the metrics may take a while.