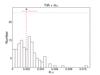
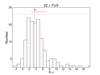
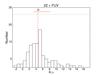
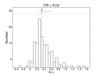
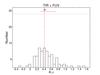
Fig. 16
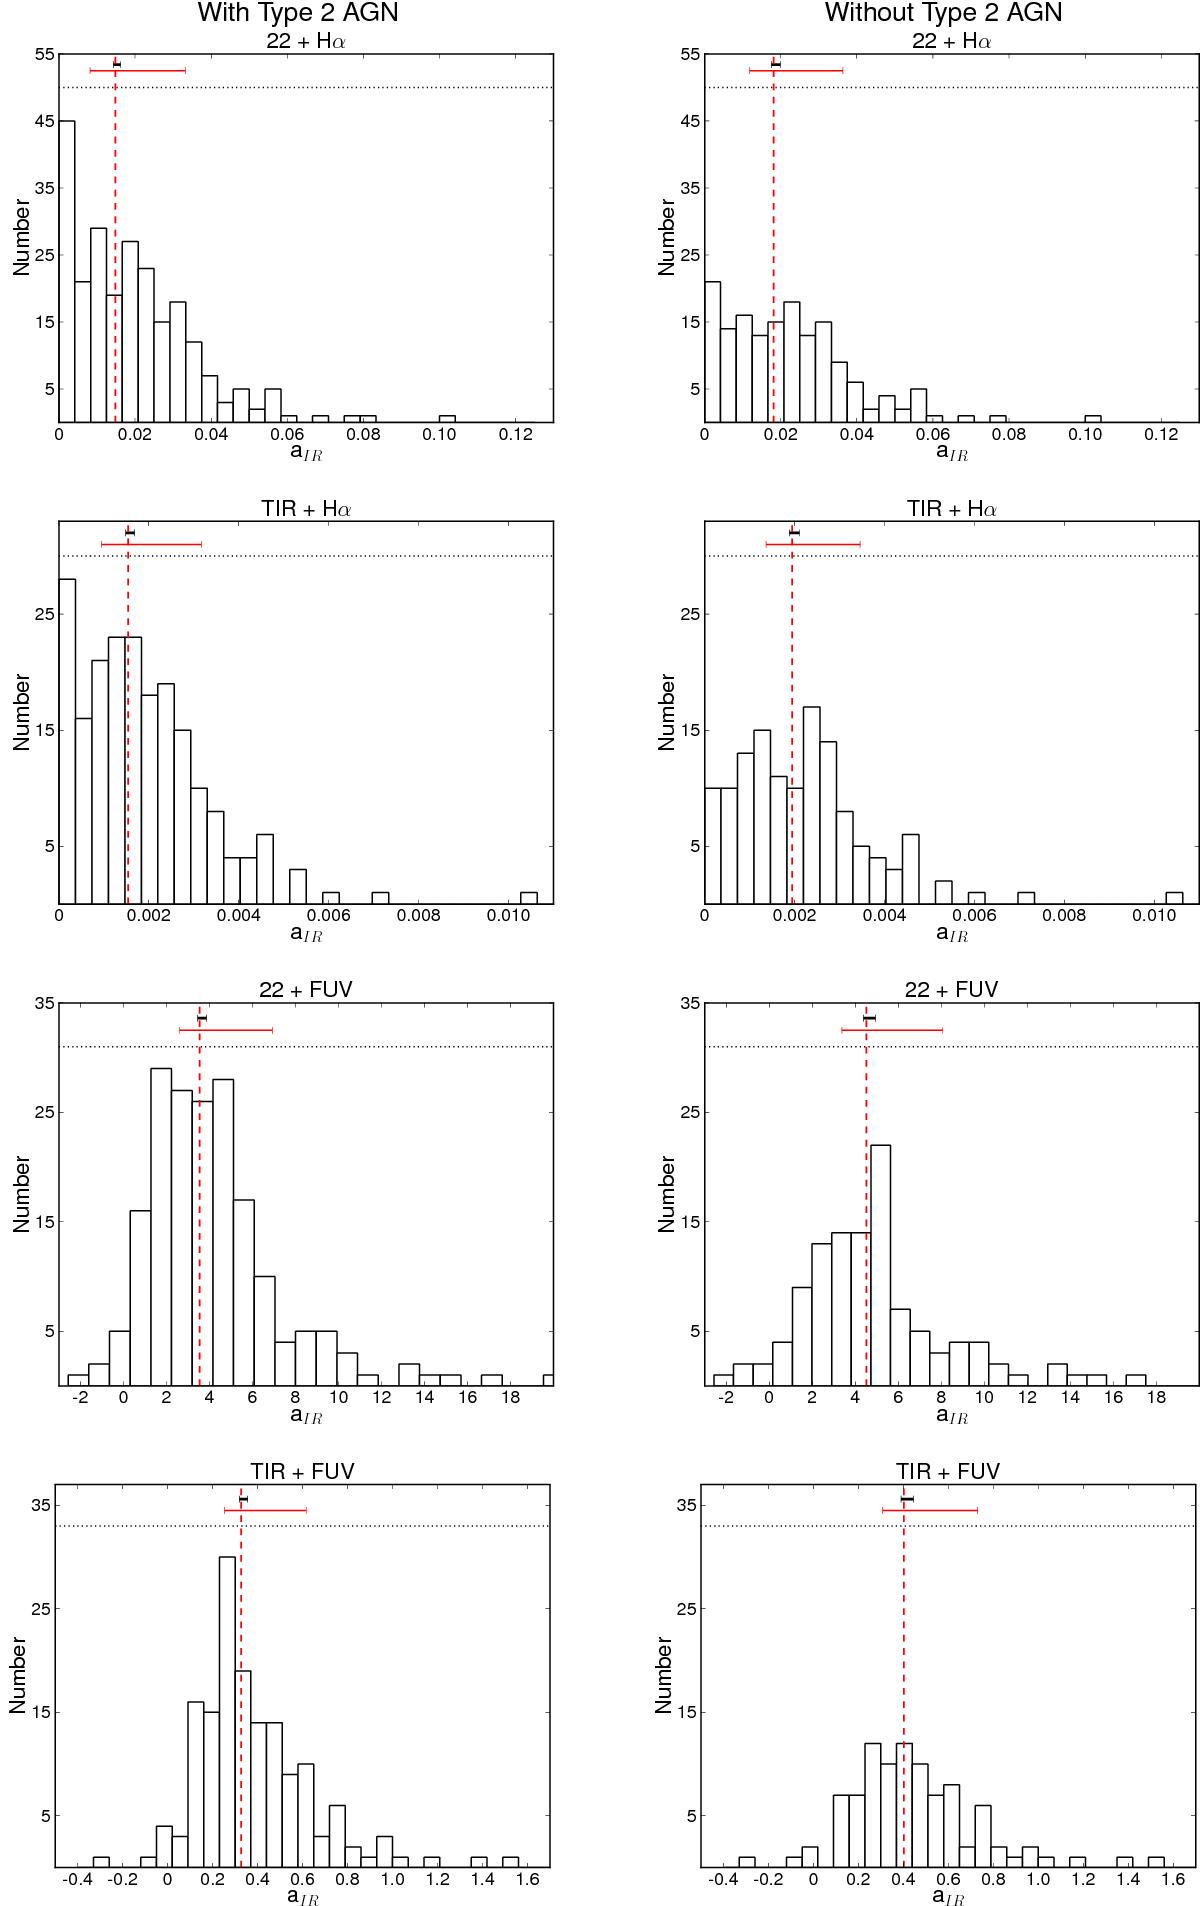
Histograms showing the distribution of the aIR coefficient values obtained for the different hybrid tracers. The parameter aIR is computed using the expressions 16 and 17. The red dashed line corresponds to the median value of this coefficient. The red tick marks shown at the top refers to the 1σ dispersions measured as the interval that includes 68% of the data points around the median quoted in Table 3, while black tick marks indicate the standard error of the median computed from the asymptotic variance formula using these 1σ dispersions. Type-2 AGN galaxies are excluded from the histograms at right.
Current usage metrics show cumulative count of Article Views (full-text article views including HTML views, PDF and ePub downloads, according to the available data) and Abstracts Views on Vision4Press platform.
Data correspond to usage on the plateform after 2015. The current usage metrics is available 48-96 hours after online publication and is updated daily on week days.
Initial download of the metrics may take a while.