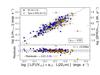
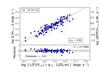
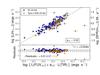
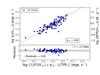
Fig. 14
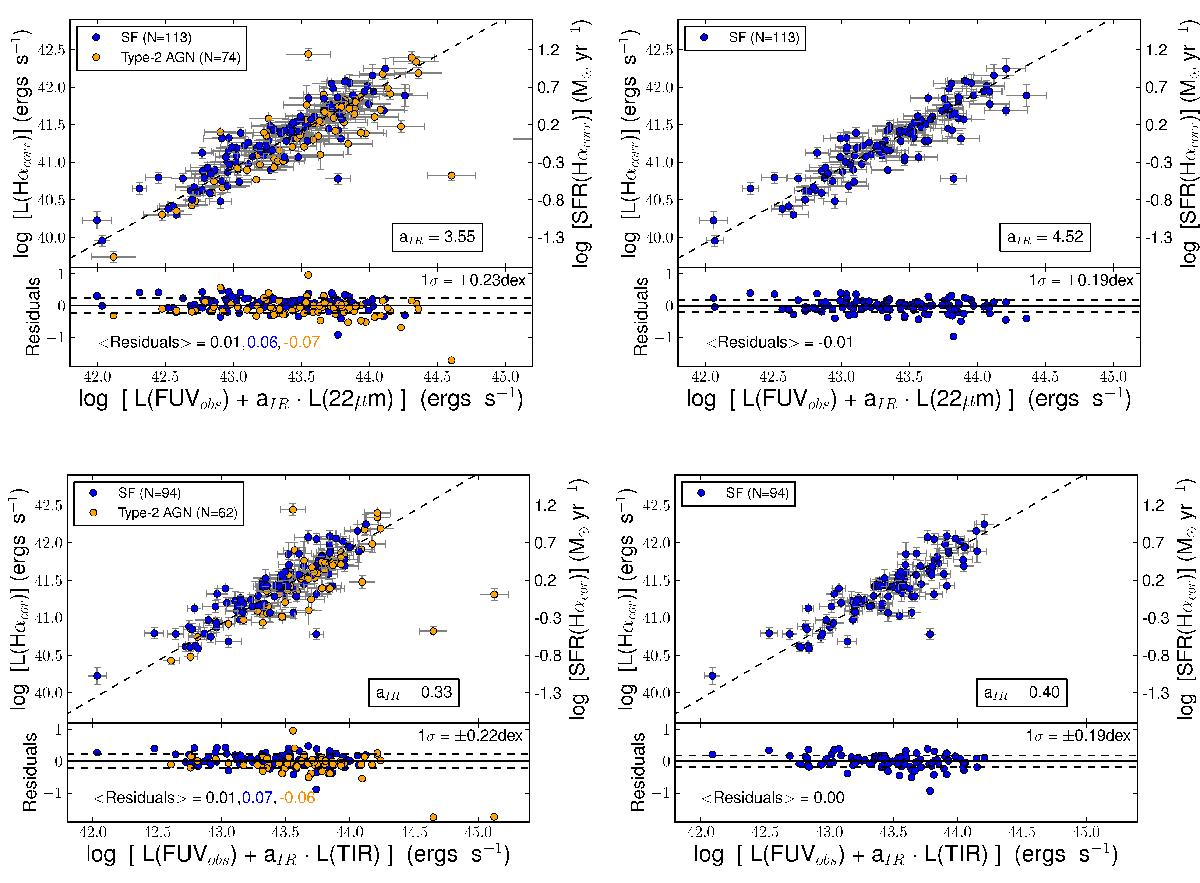
Updated calibrations for the hybrids tracers that combine FUV observed luminosity and IR luminosity. Top panels show the FUVobs + 22 μm hybrid tracer, while the FUVobs +TIR hybrid tracers appear on the bottom panels. Galaxies hosting type-2 AGN (orange points) are included on the left panels. Blue points refer to star-forming galaxies. Dashed lines correspond to the 1:1 line taking into account the CHα and CFUV constants (5.5 × 10-42 and 4.6 × 10-44) given in Eqs. (3) and (4), respectively. The best-fitting aIR coefficients calculated as the median value of the expression 17 are shown for clarity. These aIR values and their corresponding errors appear in Table 3. The residuals are computed as the average value of the log[CHα × L [Hαcorr]/(CFUV × (L [FUVobs] + aIR × L[IR]))], where L(IR) could be 22 μm or TIR, after applying a 4σ rejection. These hybrid tracers show a trend with the aIR coefficient, so when type-2 AGN host galaxies are included the value of aIR decreases.
Current usage metrics show cumulative count of Article Views (full-text article views including HTML views, PDF and ePub downloads, according to the available data) and Abstracts Views on Vision4Press platform.
Data correspond to usage on the plateform after 2015. The current usage metrics is available 48-96 hours after online publication and is updated daily on week days.
Initial download of the metrics may take a while.