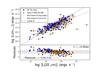
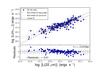
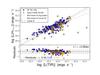
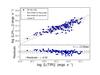
Fig. 12
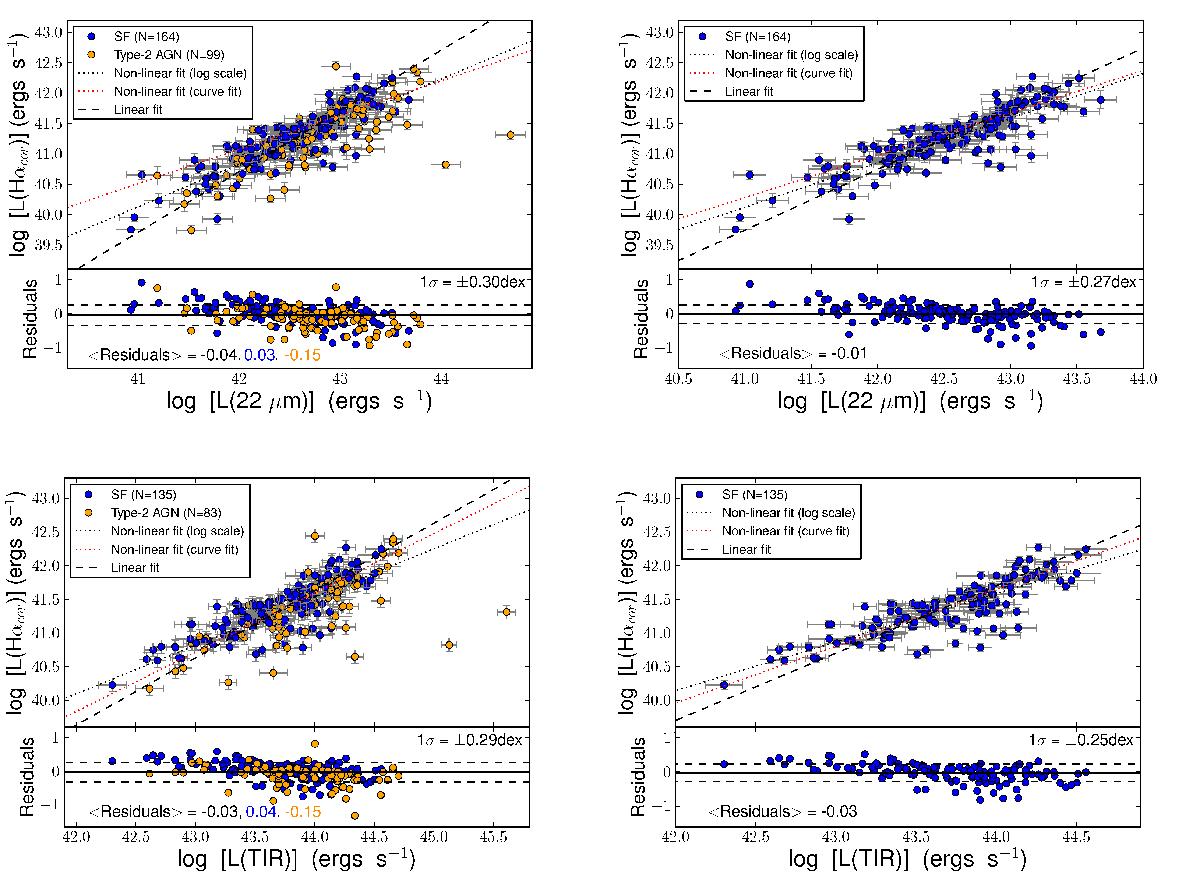
Updated calibrations for the 22 μm and TIR single-band SFR tracers anchoring them to extinction-corrected Hα luminosity (Eq. (4)). Orange points in left panels correspond to type-2 AGN, while blue points refer to star-forming galaxies. Linear fits are shown with dashed lines, while nonlinear fits are shown with dotted lines. The results for these calibrations appear in Table 2. The residuals are computed as the average value of the log[5.5 × 10-42 × L(Hαcorr)/a × L(IR)] where L(IR) could be 22 μm or TIR for the case of the linear fits, after applying a 4σ rejection. These values are computed for all galaxies (black), star-forming (blue), and type-2 AGN host galaxies (orange).
Current usage metrics show cumulative count of Article Views (full-text article views including HTML views, PDF and ePub downloads, according to the available data) and Abstracts Views on Vision4Press platform.
Data correspond to usage on the plateform after 2015. The current usage metrics is available 48-96 hours after online publication and is updated daily on week days.
Initial download of the metrics may take a while.