Fig. 1
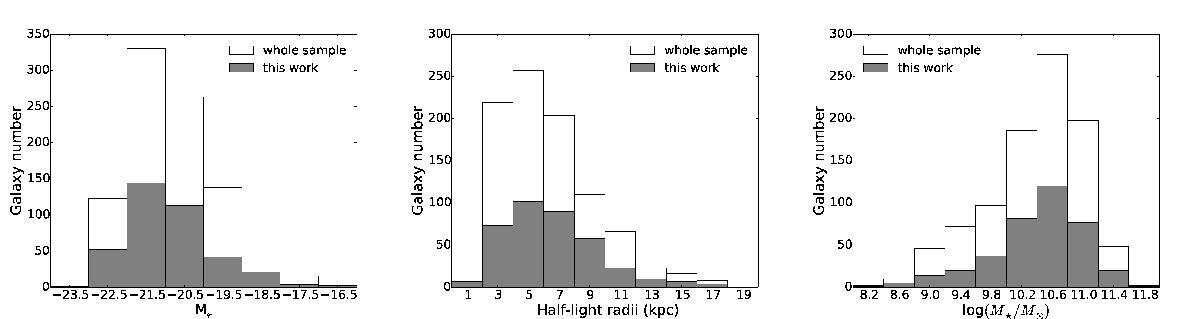
From left to right: distributions of the r-band absolute magnitude, half-light radius, and log(M⋆/M⊙). The white histograms correspond to the complete CALIFA sample (939 galaxies), and the gray-filled areas correspond to our sample (380 galaxies). A visual inspection of these histograms together with the perform of the K-S test probability show that our sample is representative in terms of galaxy properties of the entire CALIFA sample.
Current usage metrics show cumulative count of Article Views (full-text article views including HTML views, PDF and ePub downloads, according to the available data) and Abstracts Views on Vision4Press platform.
Data correspond to usage on the plateform after 2015. The current usage metrics is available 48-96 hours after online publication and is updated daily on week days.
Initial download of the metrics may take a while.