Fig. 8
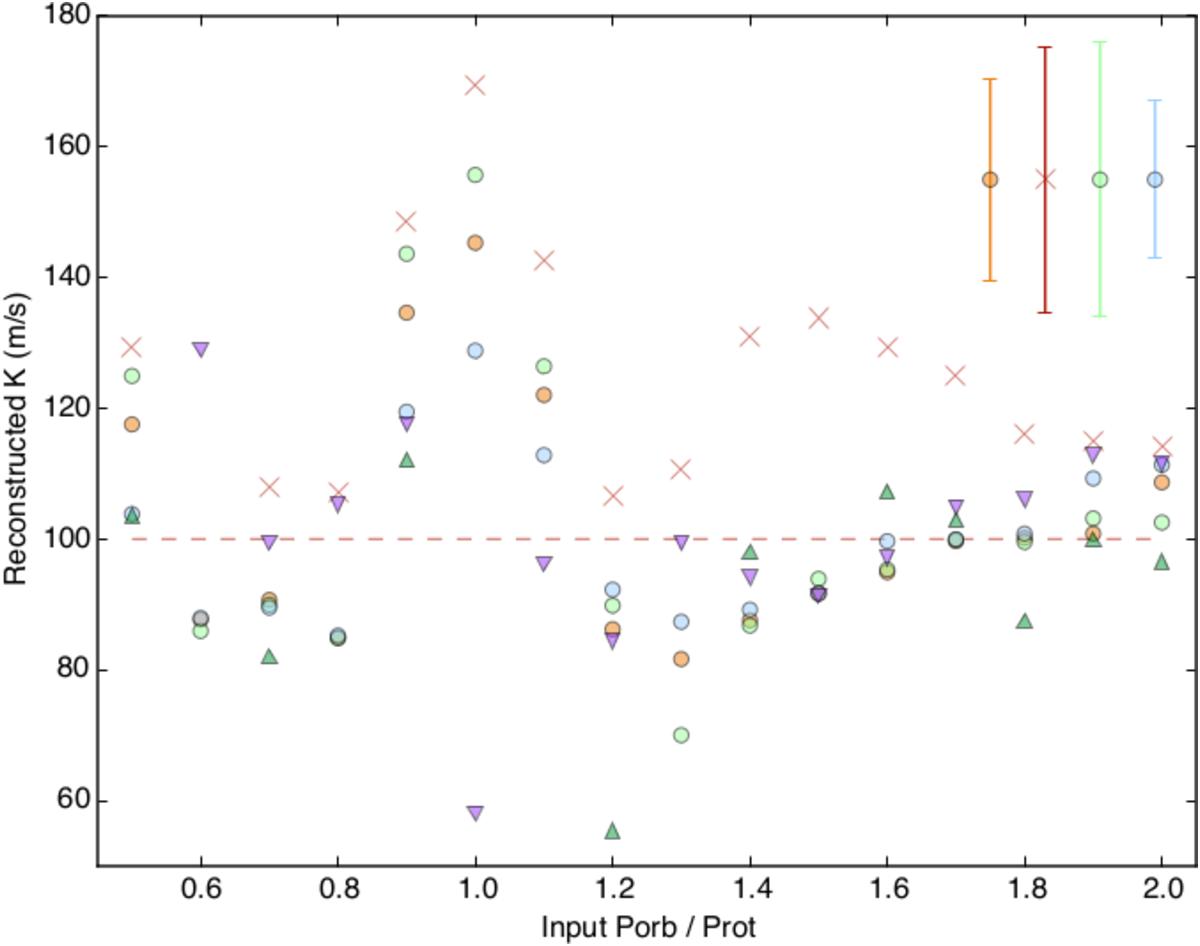
Same as the top panel of Fig. 6, with errors introduced in the reconstruction parameters. Orange circles again show the points of Fig. 6, obtained with ![]() and i = 38°, i.e. our optimal model. Green and pale blue circles are obtained by forcing
and i = 38°, i.e. our optimal model. Green and pale blue circles are obtained by forcing ![]() and 0.94, respectively, during reconstruction. Violet (resp. green) triangles show the effect of forcing i = 33° (resp. i = 43°). Crosses are obtained by adding another noise pattern to our fake data set (using a different seed to generate random numbers, still resulting in S/N ≈ 1000). Typical error bars are indicated in the top right side of the plot, except for violet and green triangles (affected by much larger statistical error bars that would hamper the plot readability).
and 0.94, respectively, during reconstruction. Violet (resp. green) triangles show the effect of forcing i = 33° (resp. i = 43°). Crosses are obtained by adding another noise pattern to our fake data set (using a different seed to generate random numbers, still resulting in S/N ≈ 1000). Typical error bars are indicated in the top right side of the plot, except for violet and green triangles (affected by much larger statistical error bars that would hamper the plot readability).
Current usage metrics show cumulative count of Article Views (full-text article views including HTML views, PDF and ePub downloads, according to the available data) and Abstracts Views on Vision4Press platform.
Data correspond to usage on the plateform after 2015. The current usage metrics is available 48-96 hours after online publication and is updated daily on week days.
Initial download of the metrics may take a while.