Fig. 3
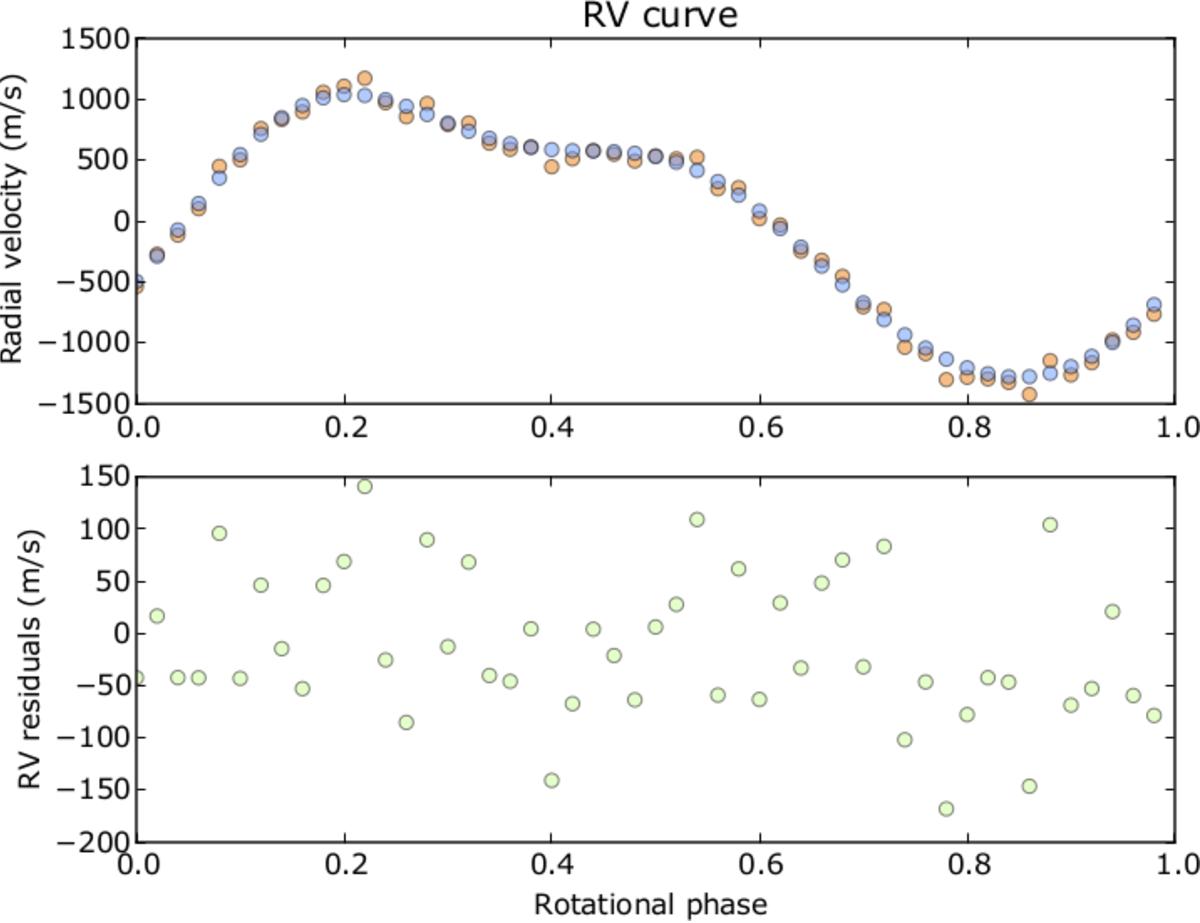
Radial velocity time series extracted from our set of simulated cross-correlation profiles using the first moment method (top panel, orange dots), plotted together with radial velocities produced by the Doppler imaging code (blue dots). This model does not include any orbiting planet. The bottom panel shows the RV residuals.
Current usage metrics show cumulative count of Article Views (full-text article views including HTML views, PDF and ePub downloads, according to the available data) and Abstracts Views on Vision4Press platform.
Data correspond to usage on the plateform after 2015. The current usage metrics is available 48-96 hours after online publication and is updated daily on week days.
Initial download of the metrics may take a while.