Fig. 2
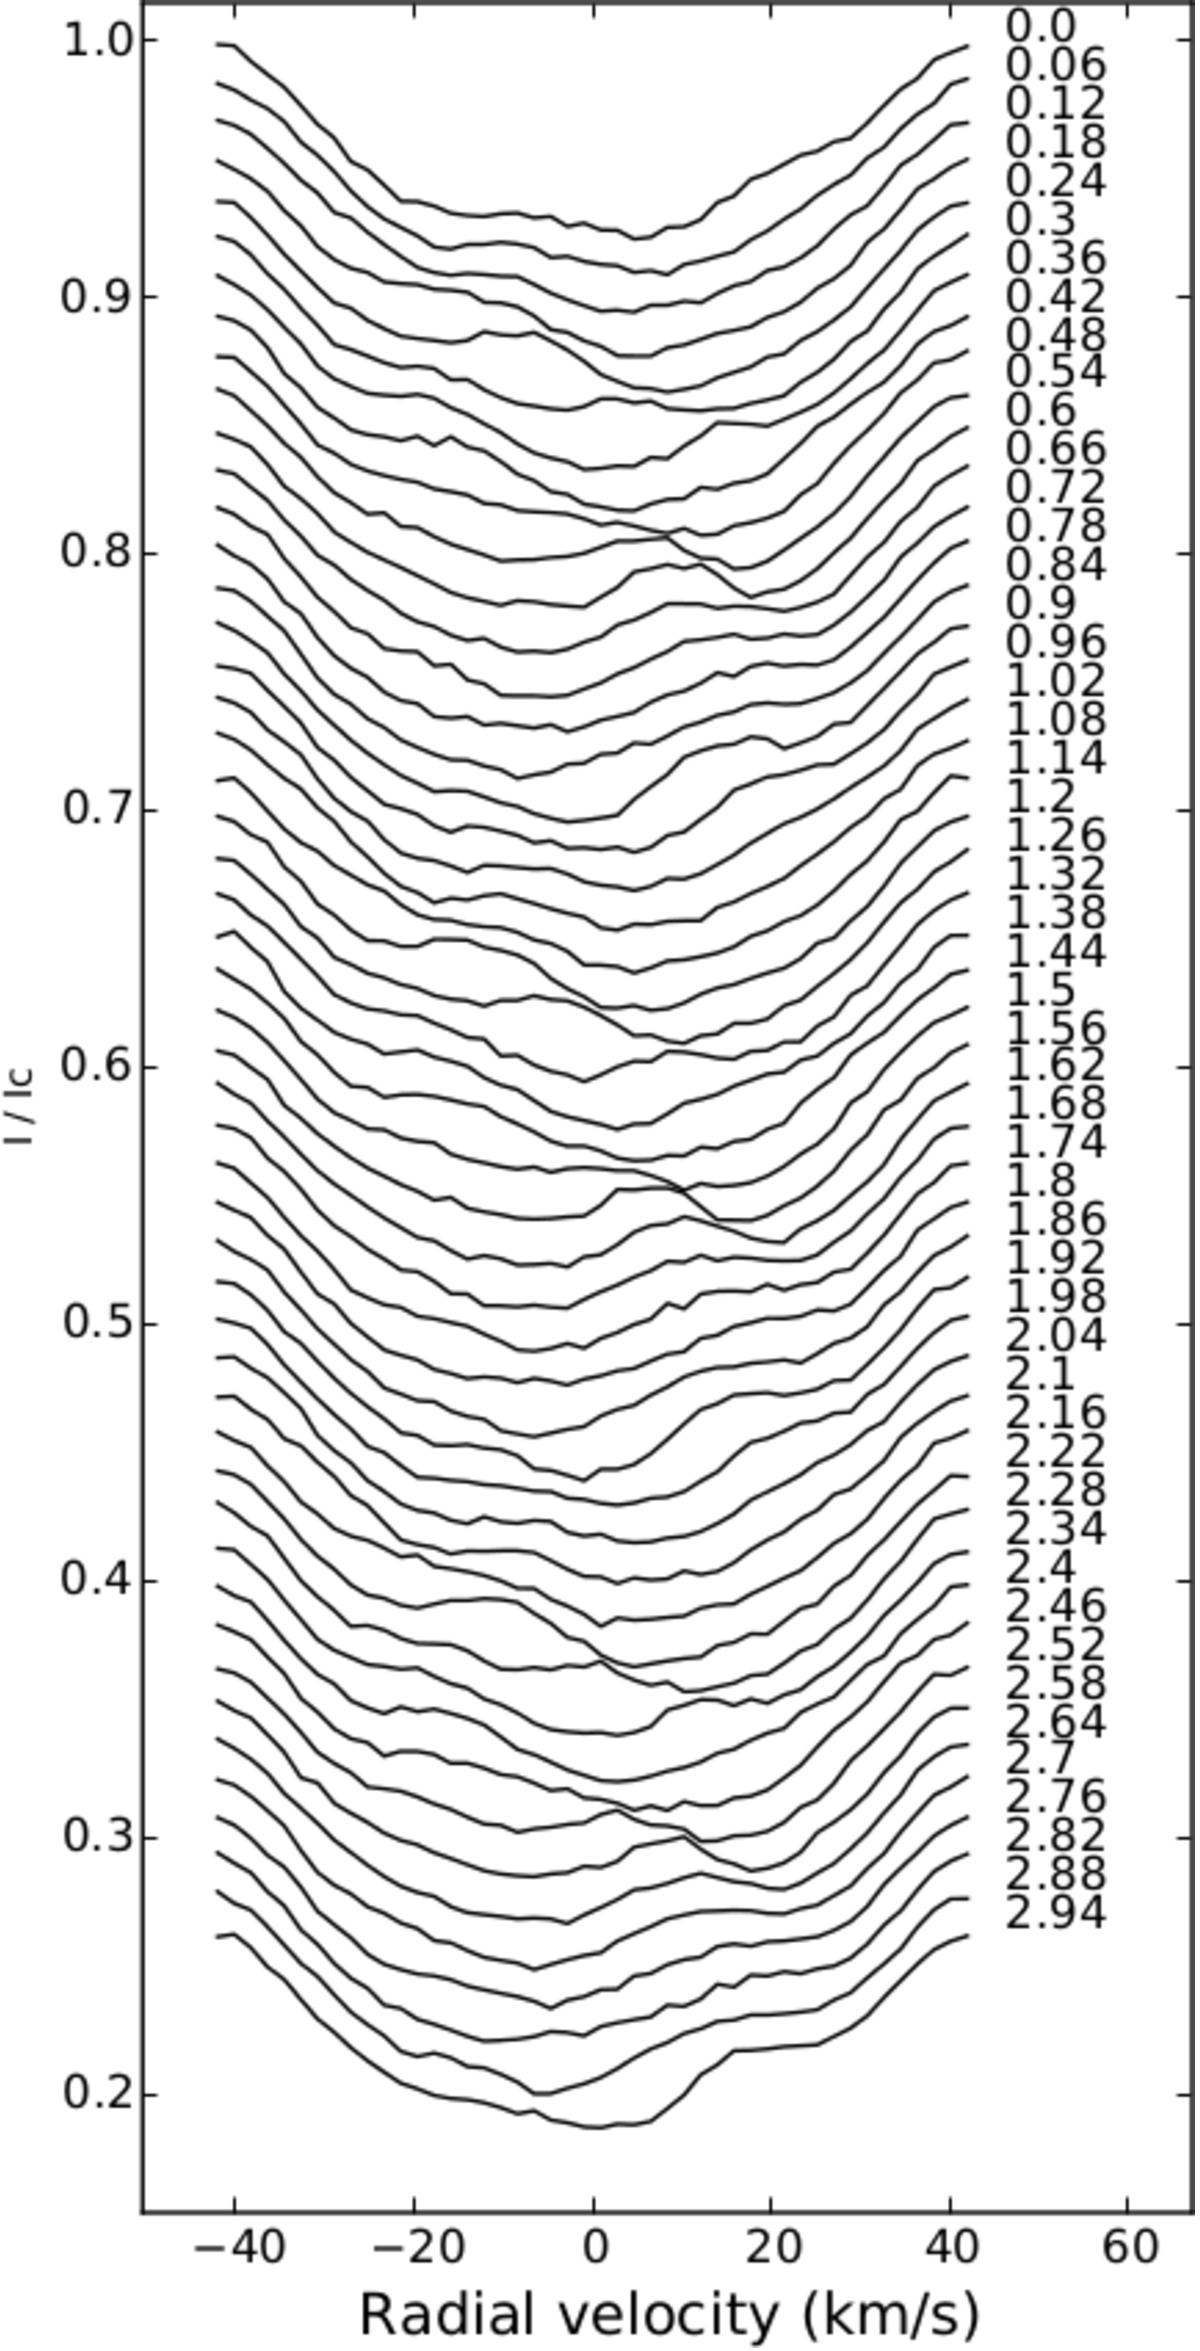
Simulated line profiles (normalized to the continuum level) generated from the artificial star of Fig. 1, in the absence of a planetary companion. Successive profiles are vertically shifted for display clarity and the rotational phase of simulated observation is given in the right side of the plot (with the integer part indicating the rotation cycle number).
Current usage metrics show cumulative count of Article Views (full-text article views including HTML views, PDF and ePub downloads, according to the available data) and Abstracts Views on Vision4Press platform.
Data correspond to usage on the plateform after 2015. The current usage metrics is available 48-96 hours after online publication and is updated daily on week days.
Initial download of the metrics may take a while.