Fig. 4
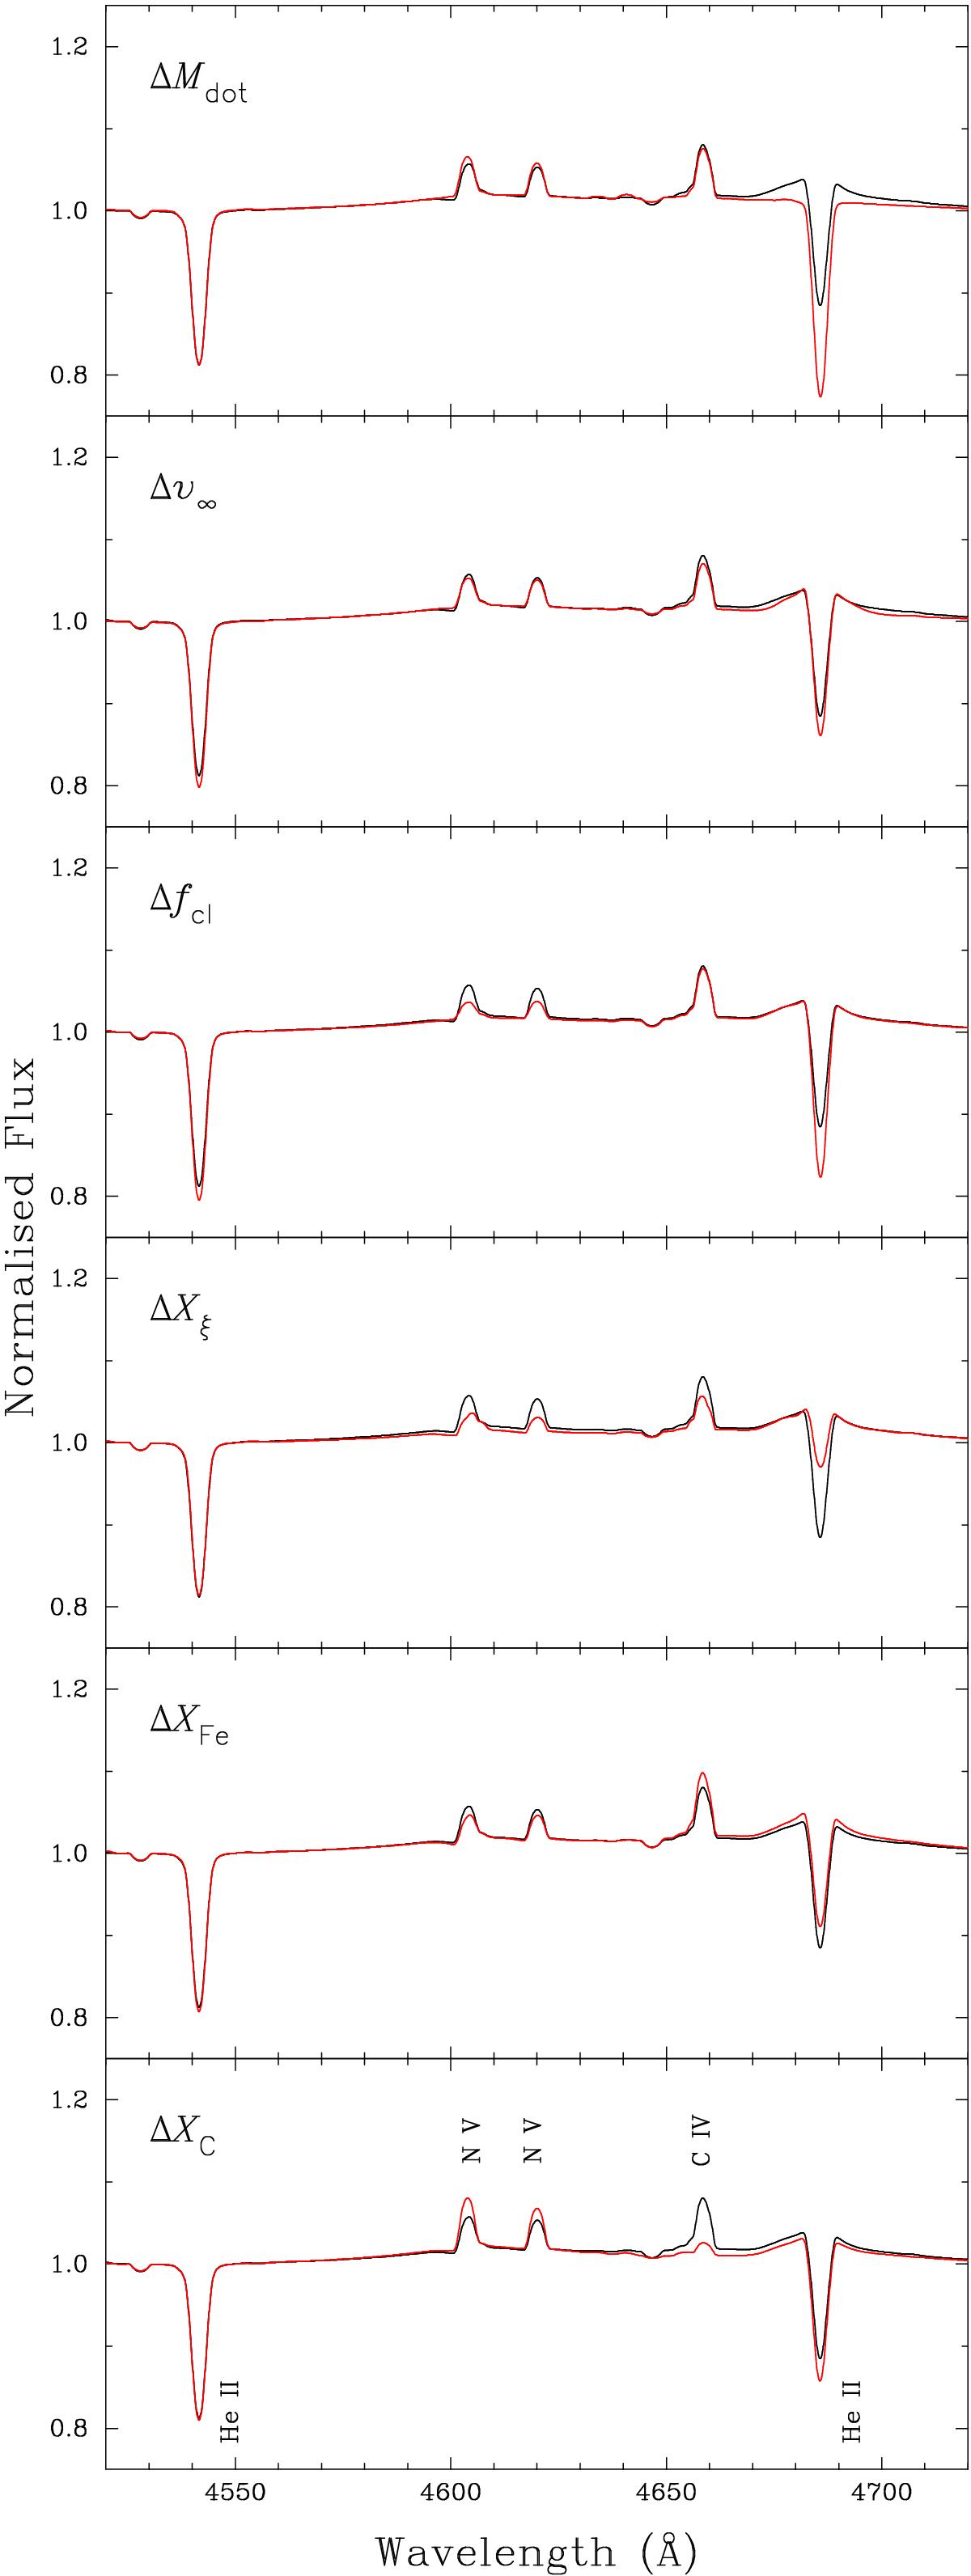
Synthetic PoWR spectra (black line) adopting parameters for AAΩ 30 Dor 254 from Evans et al. (2010). The spectra plotted in red, moving from the top to bottom, are models which vary the mass-loss rate (Mdot), terminal velocity (v∞) clumping factor (fcl), microturbulence (ξ), iron abundance (XFe, to investigate possible blanketing effects), and carbon abundance (XC), as detailed in Sect. 3.1. The lines identified in the lower panel are He II λλ4542, 4686; N V λλ4604-20, and C IV λ4658.
Current usage metrics show cumulative count of Article Views (full-text article views including HTML views, PDF and ePub downloads, according to the available data) and Abstracts Views on Vision4Press platform.
Data correspond to usage on the plateform after 2015. The current usage metrics is available 48-96 hours after online publication and is updated daily on week days.
Initial download of the metrics may take a while.