Free Access
Fig. 9
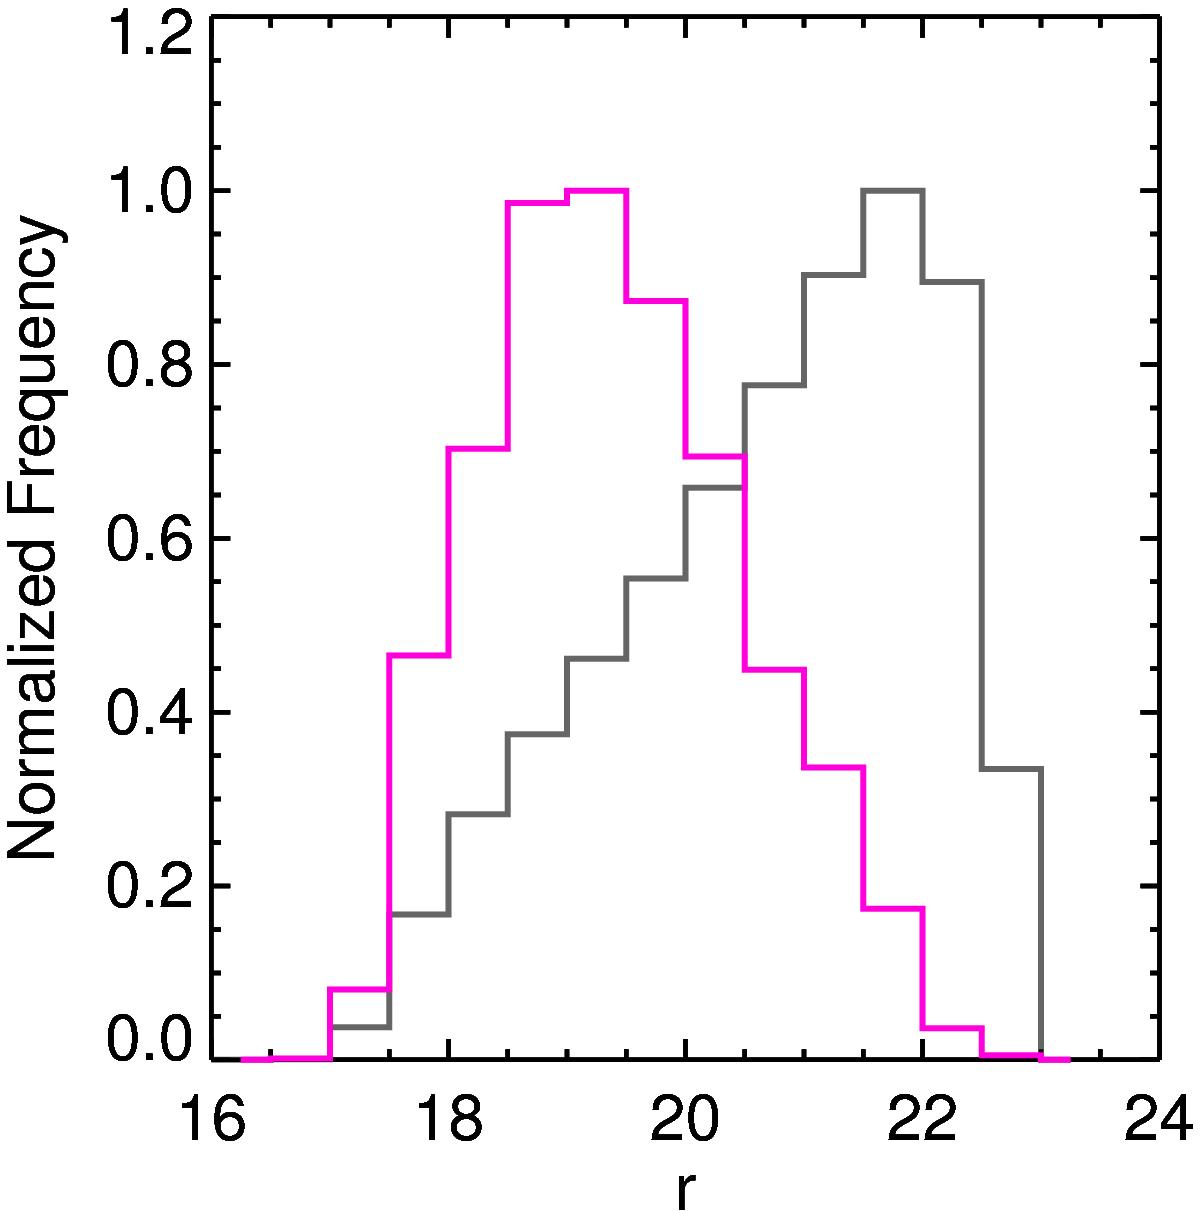
Histogram of the normalized magnitude distribution in the r band of the point sources from RCS-2 (color gray) and the new data set DS1 that was obtained by matching its distribution with the distribution of TrS1.
Current usage metrics show cumulative count of Article Views (full-text article views including HTML views, PDF and ePub downloads, according to the available data) and Abstracts Views on Vision4Press platform.
Data correspond to usage on the plateform after 2015. The current usage metrics is available 48-96 hours after online publication and is updated daily on week days.
Initial download of the metrics may take a while.