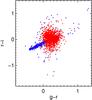
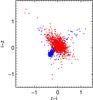
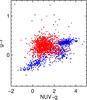
Fig. 4
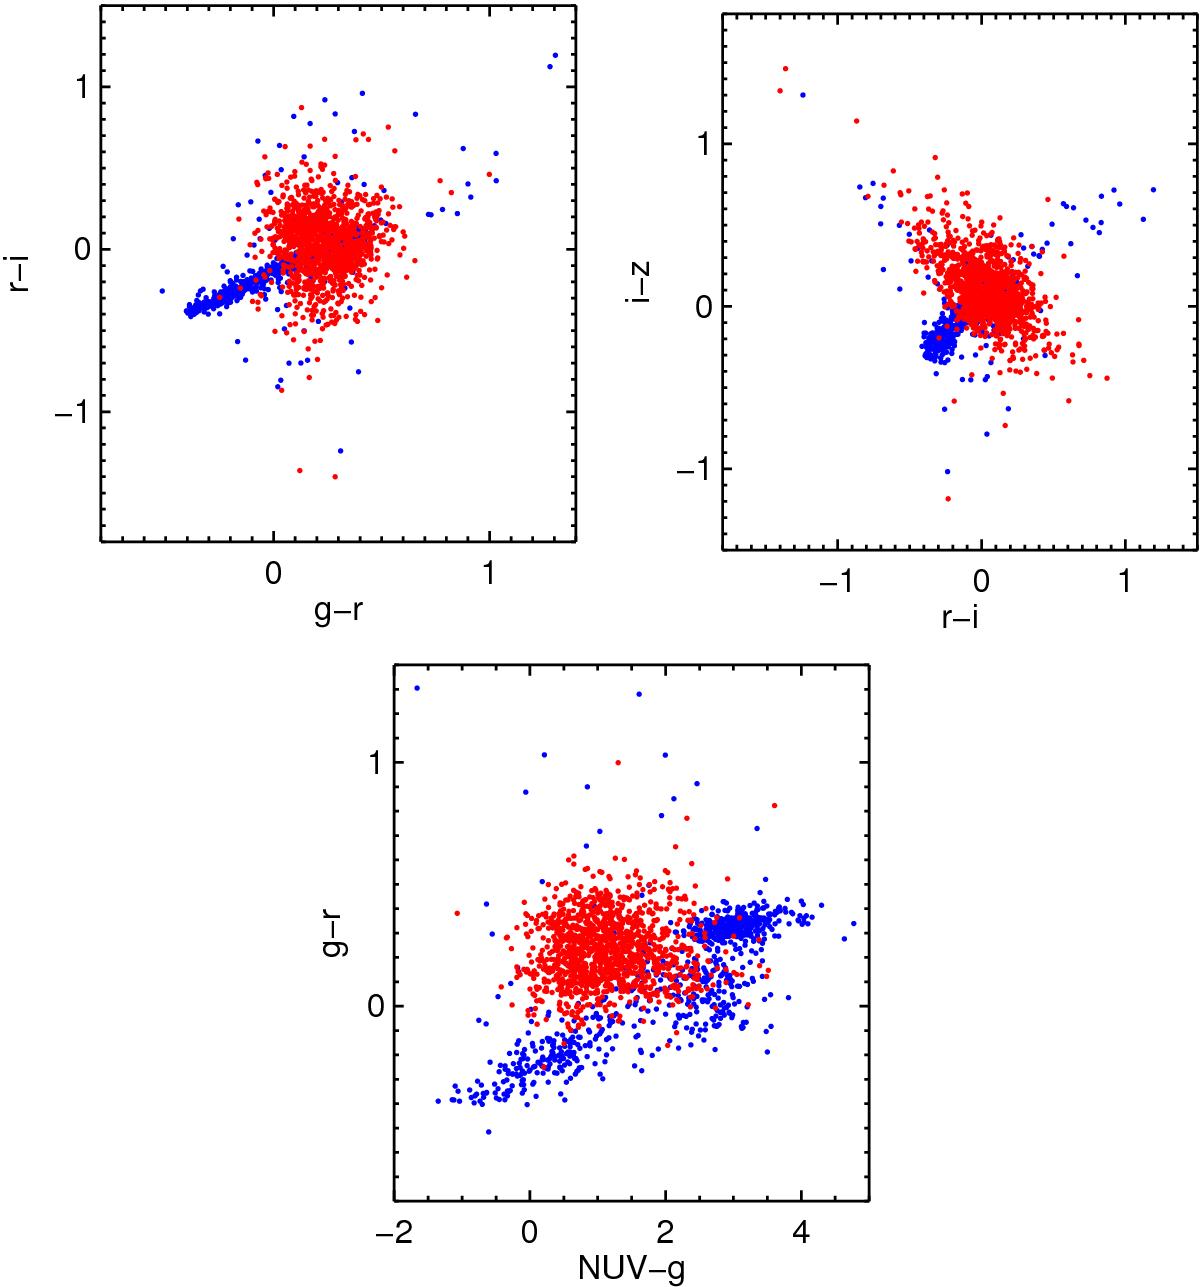
Color−color diagrams of spectroscopically confirmed quasars (red) and stars (blue) in RCS-2. The upper diagrams show the optical g−r vs. r−i (left) and r−i vs. i−z (right) color plots. The bottom plot shows the NUV-g vs. g−i color space when including GALEX data. It can be seen that including the UV data provides a clearer separation between quasars and stars compared to solely optical data.
Current usage metrics show cumulative count of Article Views (full-text article views including HTML views, PDF and ePub downloads, according to the available data) and Abstracts Views on Vision4Press platform.
Data correspond to usage on the plateform after 2015. The current usage metrics is available 48-96 hours after online publication and is updated daily on week days.
Initial download of the metrics may take a while.