Free Access
Fig. 12
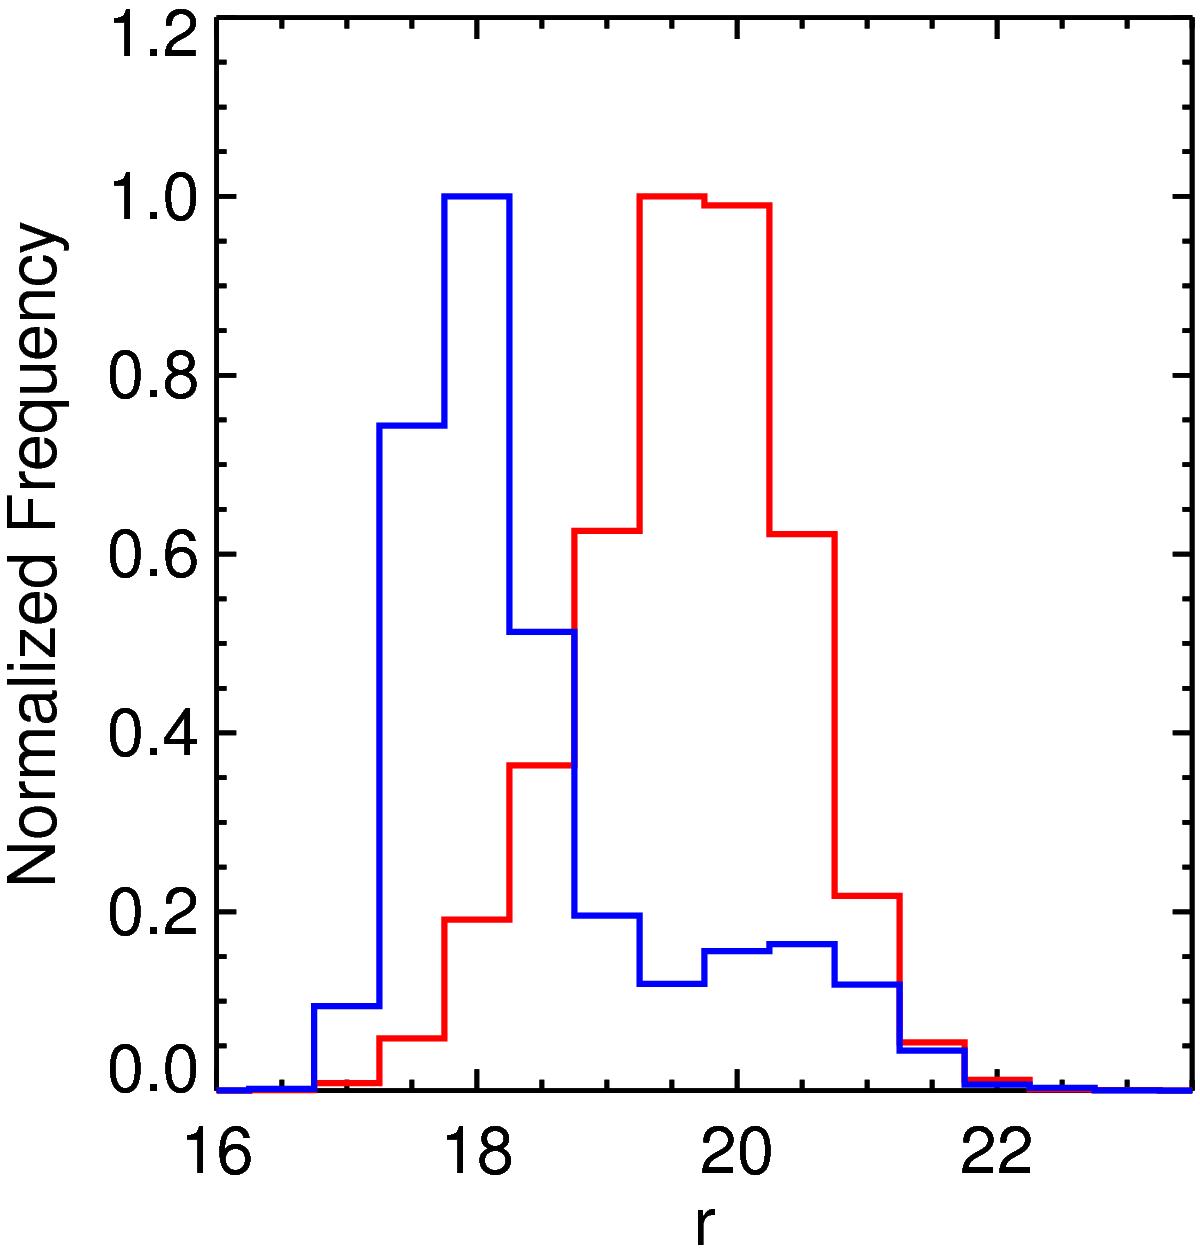
Resulting normalized r-band distributions of sources classified in DS2 by the random forest algorithm, quasars (red) and stars (blue). The difference in these distributions mirrors those presented in the TrS2 training set data shown in Fig. 5.
Current usage metrics show cumulative count of Article Views (full-text article views including HTML views, PDF and ePub downloads, according to the available data) and Abstracts Views on Vision4Press platform.
Data correspond to usage on the plateform after 2015. The current usage metrics is available 48-96 hours after online publication and is updated daily on week days.
Initial download of the metrics may take a while.