Free Access
Fig. 1
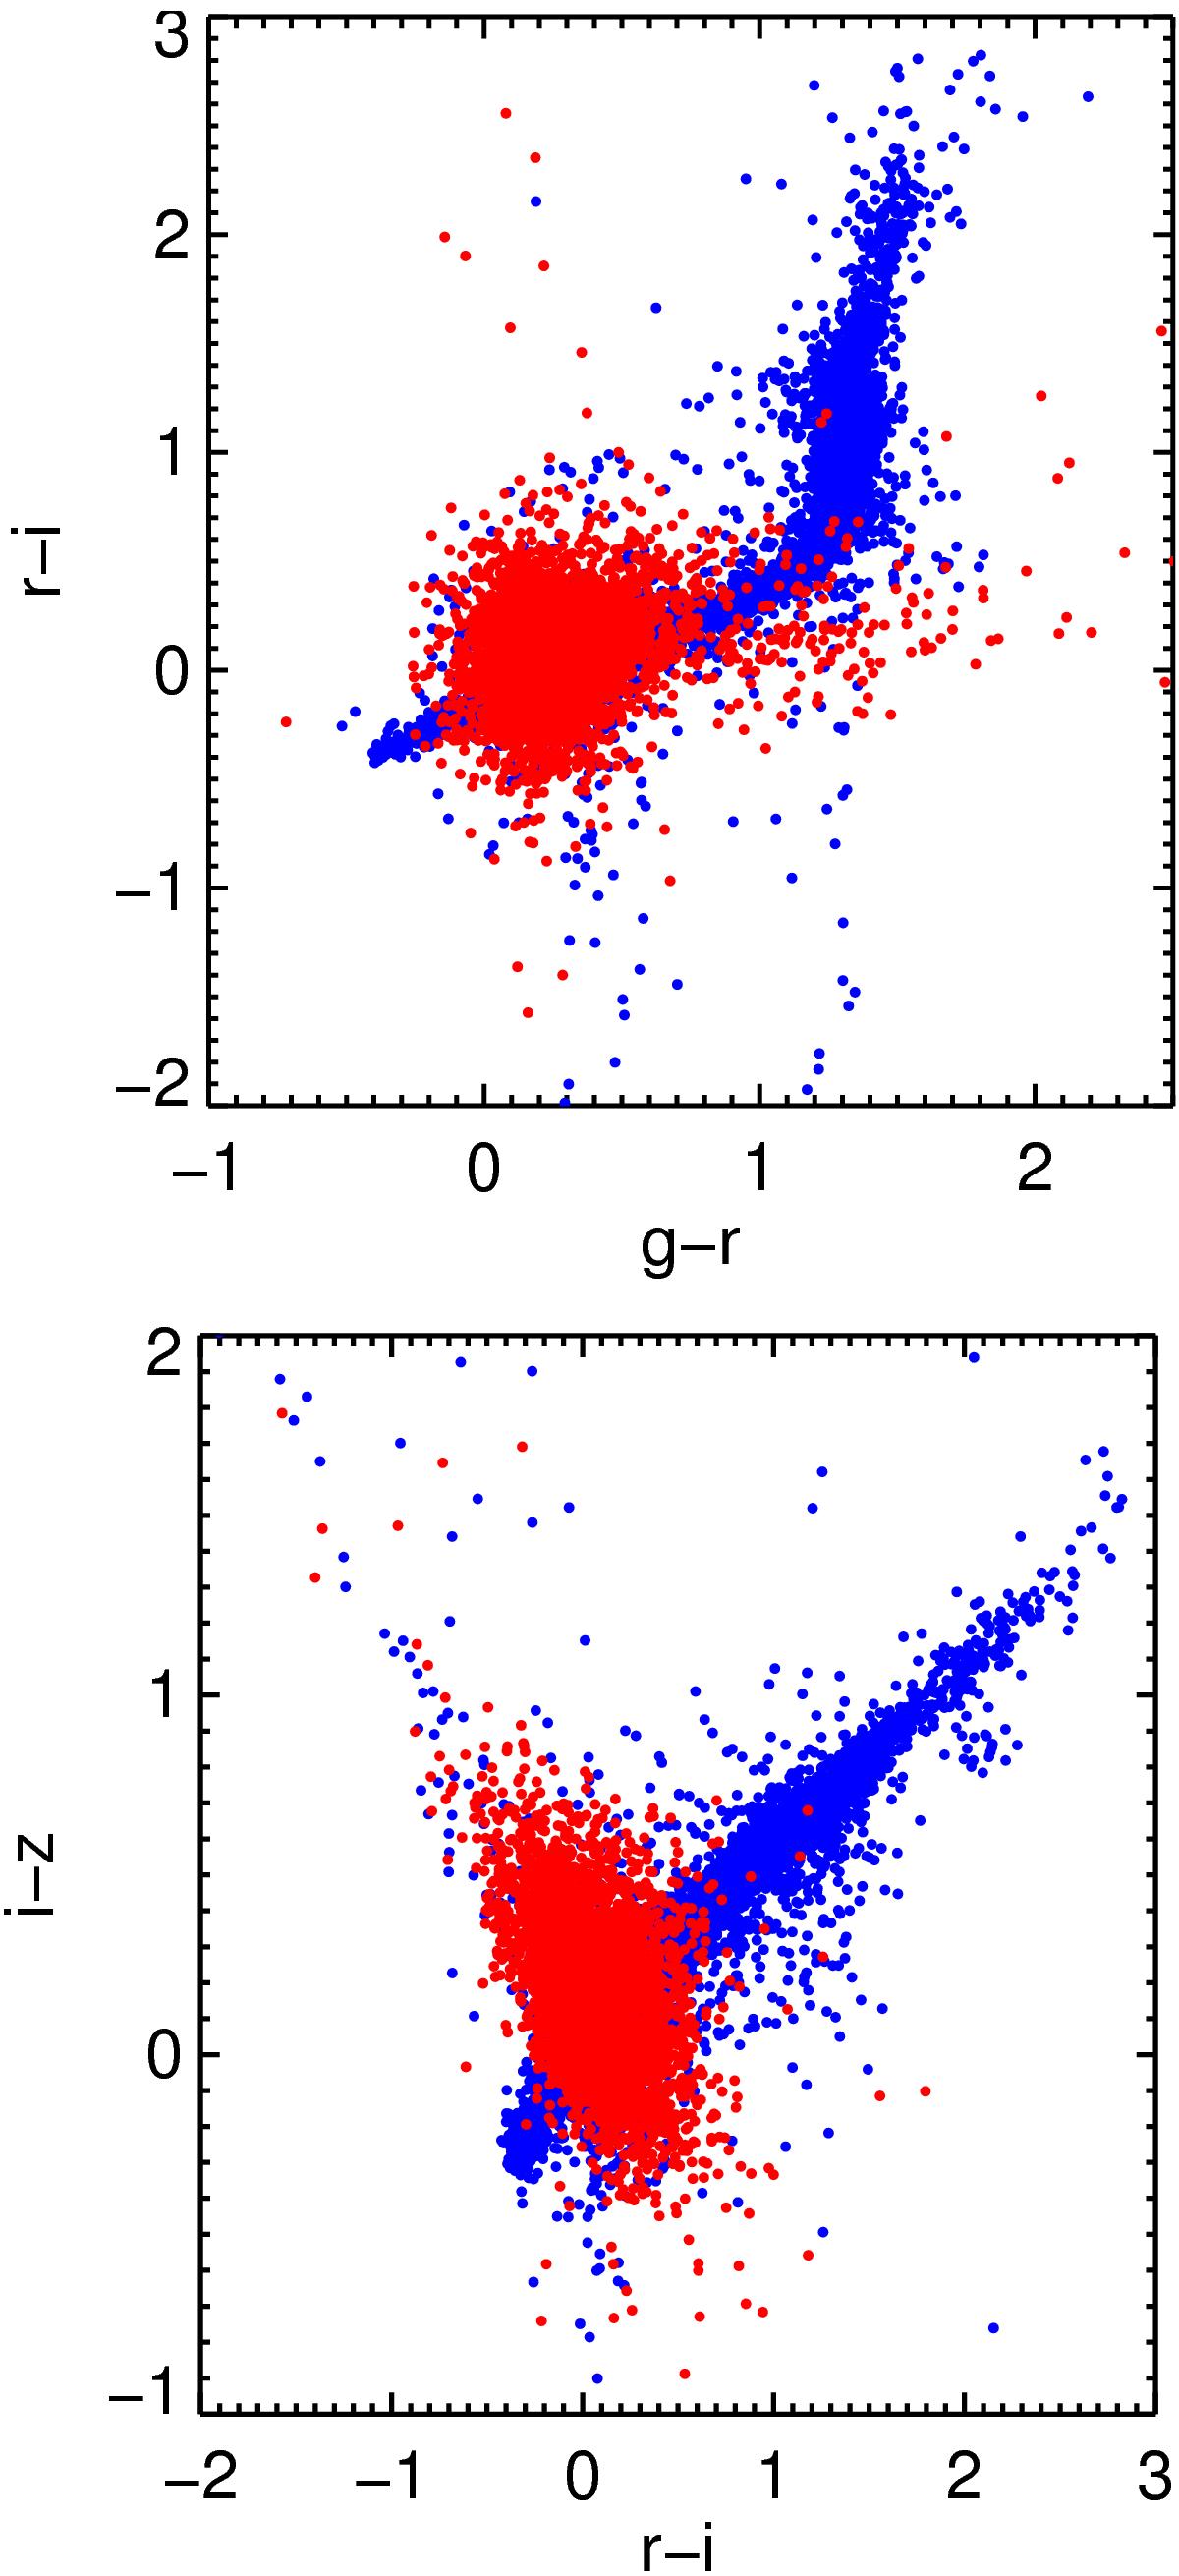
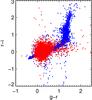
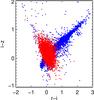
Color−color diagrams of spectroscopically confirmed quasars (red) and stars (blue) in RCS-2. The upper diagram shows the colors g−r vs. r−i, and the bottom diagram shows the colors r−i vs. i−z. While it is possible to see a quasar clump and a stellar locus, in both cases there is no clean way to separate them.
This figure is made of several images, please see below:
Current usage metrics show cumulative count of Article Views (full-text article views including HTML views, PDF and ePub downloads, according to the available data) and Abstracts Views on Vision4Press platform.
Data correspond to usage on the plateform after 2015. The current usage metrics is available 48-96 hours after online publication and is updated daily on week days.
Initial download of the metrics may take a while.