Fig. 5
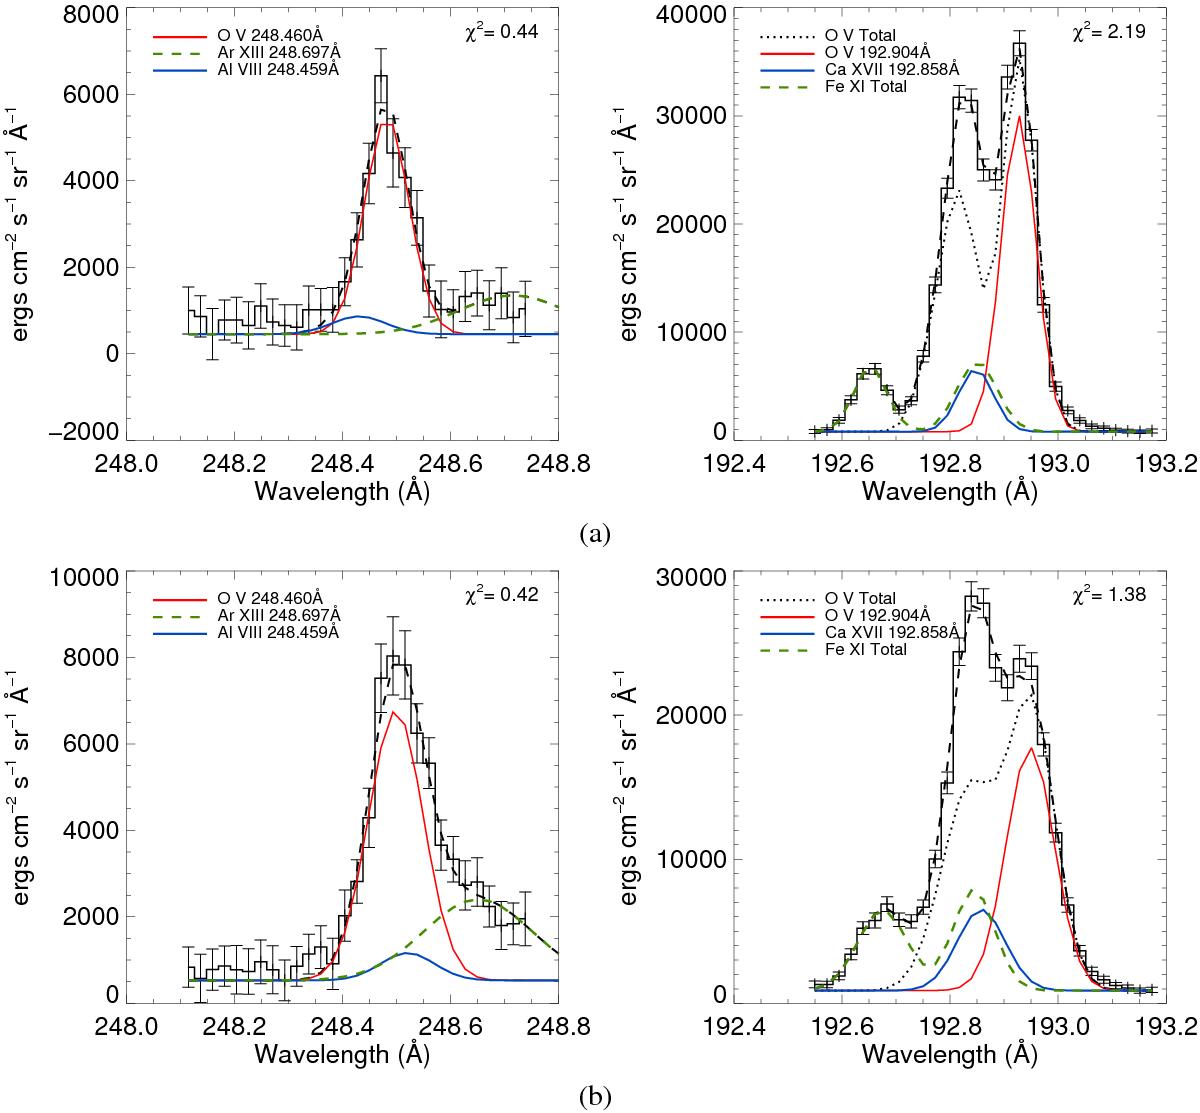
Fitted spectra for Flare 1 using the brightest pixels for Footpoints 1 and 2 – plots a) and b) respectively. For both spectral profiles the total fit and data is shown in black solid and dashed lines respectively. The calibrated 1σ errors on each data point are also plotted including the reduced χ2 value for the fit. The oxygen lines forming the diagnostic ratio are plotted in red in both columns, with the various blends described by the legend.
Current usage metrics show cumulative count of Article Views (full-text article views including HTML views, PDF and ePub downloads, according to the available data) and Abstracts Views on Vision4Press platform.
Data correspond to usage on the plateform after 2015. The current usage metrics is available 48-96 hours after online publication and is updated daily on week days.
Initial download of the metrics may take a while.