Free Access
Fig. 4
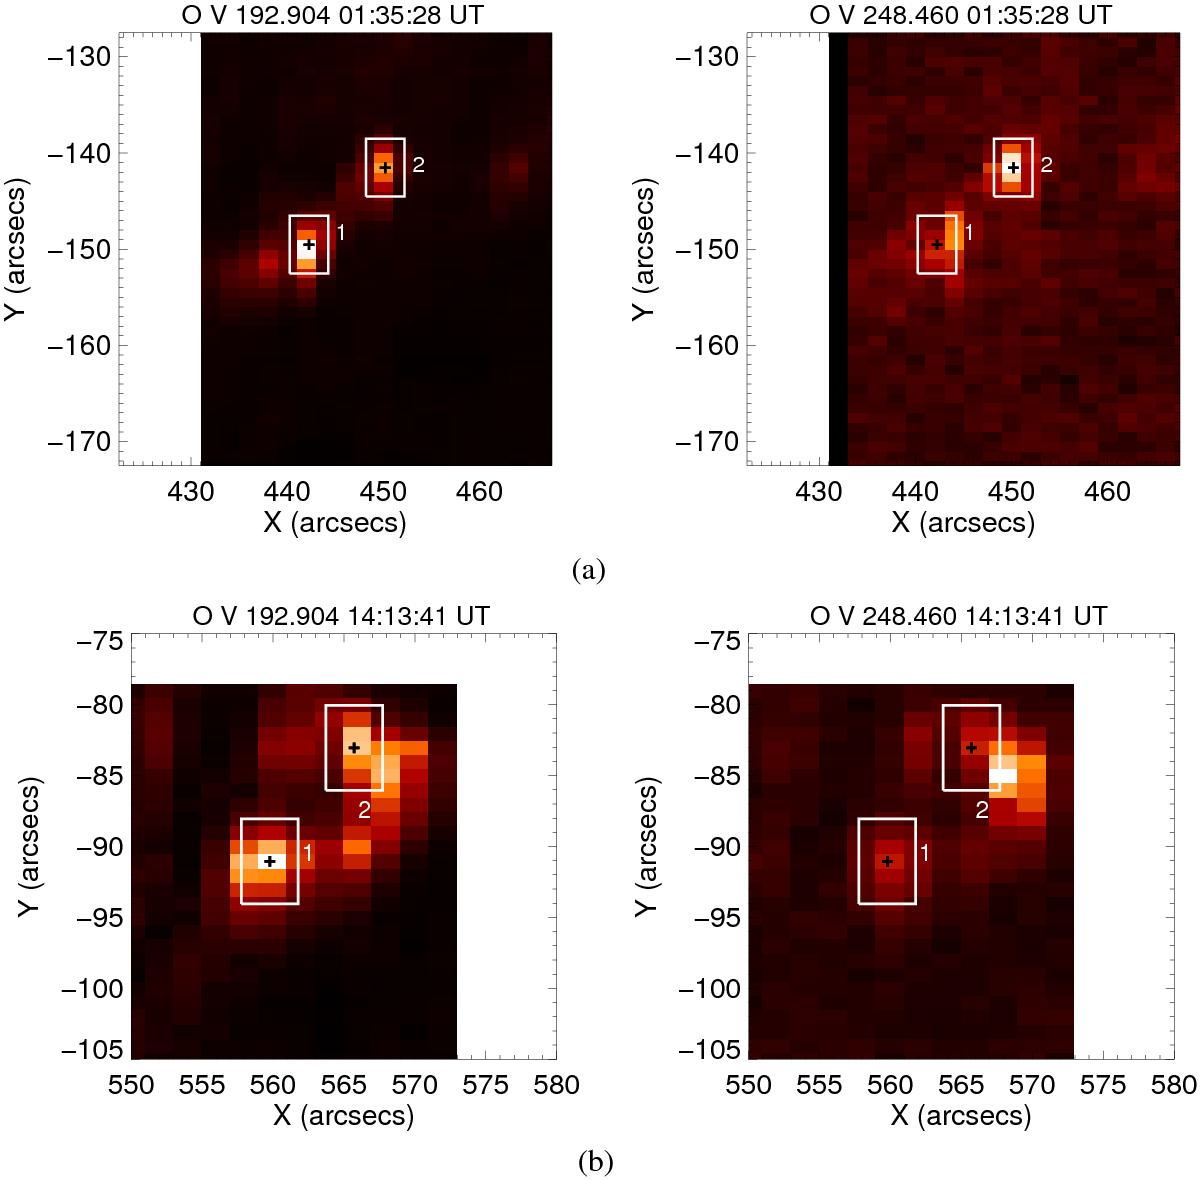
Intensity maps for both 192.904 Å and 248.460 Å lines corresponding to the impulsive phase for both flares. Two footpoints regions (1 and 2) are bounded in each flare by a white box (pixels under the line are included in the selection). The brightest pixel within each footpoint region is also identified by a black cross.
This figure is made of several images, please see below:
Current usage metrics show cumulative count of Article Views (full-text article views including HTML views, PDF and ePub downloads, according to the available data) and Abstracts Views on Vision4Press platform.
Data correspond to usage on the plateform after 2015. The current usage metrics is available 48-96 hours after online publication and is updated daily on week days.
Initial download of the metrics may take a while.