Fig. 2
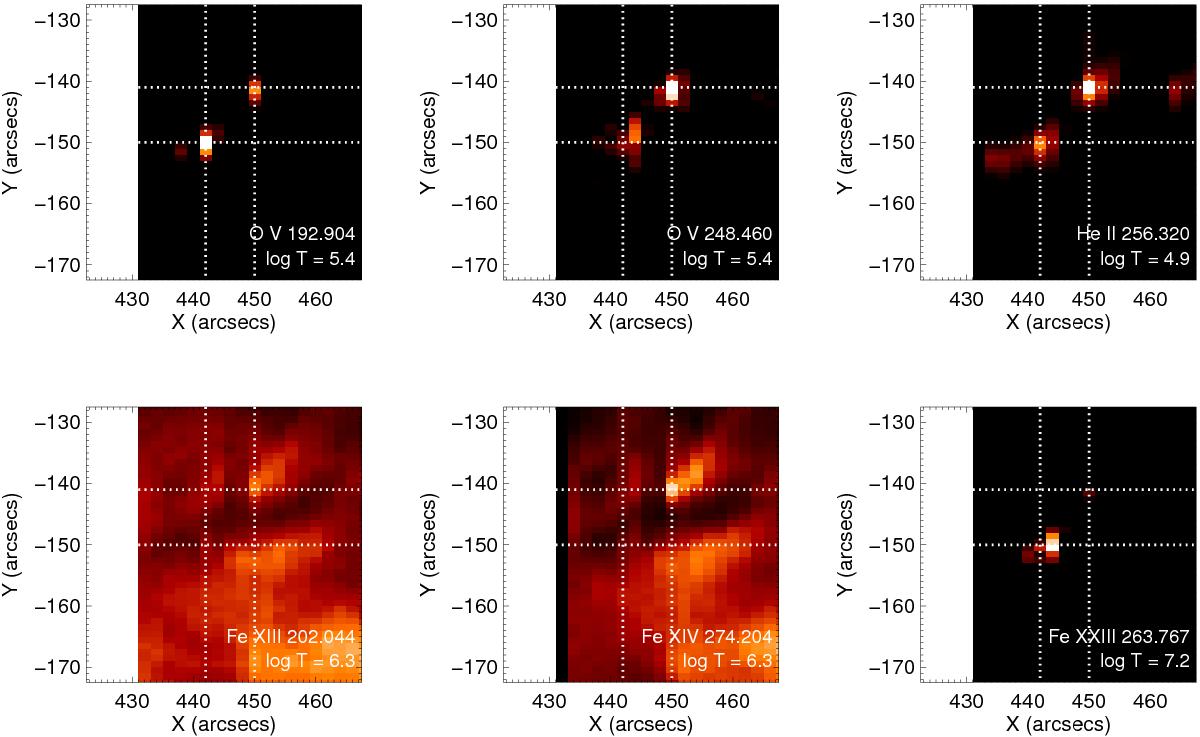
Fitted intensities in several different temperature lines for the 01:35:28 UT raster (Flare 1) after correcting for the EIS detector offset. White dotted lines show the position of the footpoints in each image relative to the O v 192 Å line. The x-offset is highlighted by the black strip on the left of the Fe xiv 274 Å image.
Current usage metrics show cumulative count of Article Views (full-text article views including HTML views, PDF and ePub downloads, according to the available data) and Abstracts Views on Vision4Press platform.
Data correspond to usage on the plateform after 2015. The current usage metrics is available 48-96 hours after online publication and is updated daily on week days.
Initial download of the metrics may take a while.