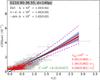
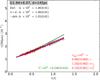
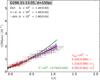
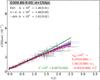
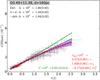
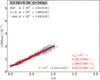
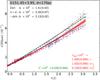
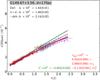
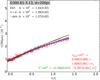
Fig. 8
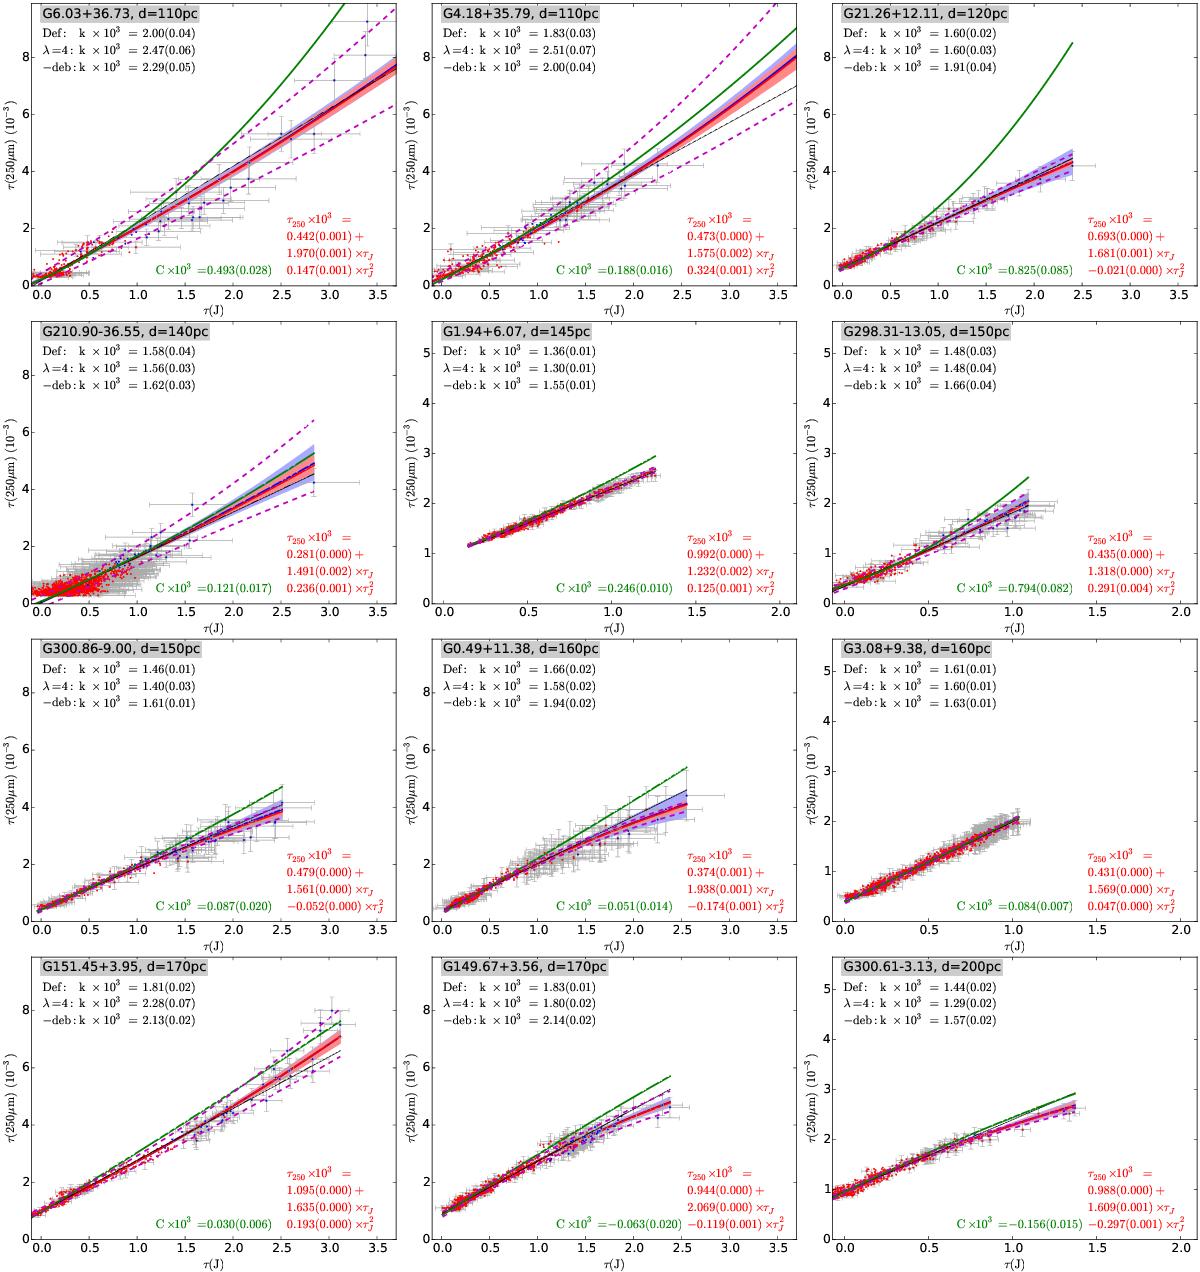
Fits of τ(250 μm) vs. τ(J) in selected fields ordered by increasing distance. The red and blue points (dust temperature above and below 14 K) with error bars are the bias-corrected data points, where τ(250 μm) is based on SPIRE data. The slopes of linear fits are listed in the upper left corner for (1) the default data set based on SPIRE data alone (“Def.”); (2) 160–500 μm data (“λ = 4”); (3) SPIRE data but without bias corrections (“-deb”). The linear fit of the default case is shown with a black line. The non-linear fits are shown with solid blue lines (MCMC) and solid red lines (bootstrapping) with associated shaded 68% confidence regions. The dashed magenta lines correspond to different bias correction of τ(J) using distances d−δd and d + δd. The parameters from bootstrapping are given in the lower right corner. The non-linear fit to data without bias corrections is plotted with a solid green curve (without error region) with the parameter C given at the bottom of the figure. The zero points of the τ(J) axes are not absolute.
Current usage metrics show cumulative count of Article Views (full-text article views including HTML views, PDF and ePub downloads, according to the available data) and Abstracts Views on Vision4Press platform.
Data correspond to usage on the plateform after 2015. The current usage metrics is available 48-96 hours after online publication and is updated daily on week days.
Initial download of the metrics may take a while.