Fig. 6
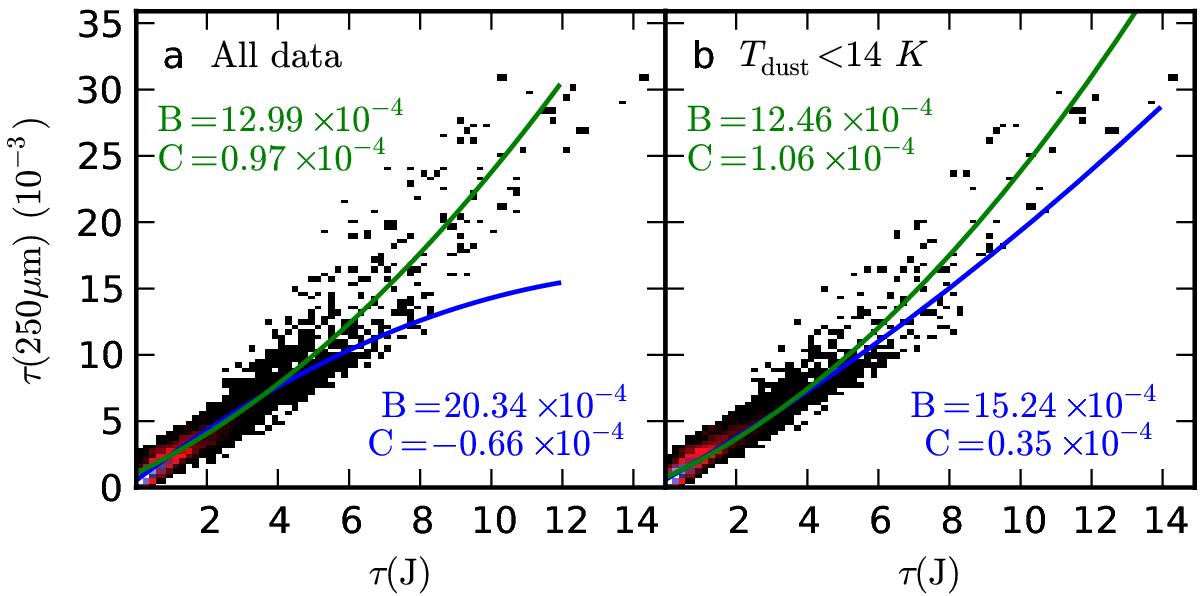
Fit of τ(250 μm) = A + B × τ(J) + C × τ(J)2 to the combined data of all fields in which individual linear fits showed a strong correlation with δk/k< 0.2. The blue and the green lines correspond to fits to the full column density range and to data points τ(J) > 1.0 alone, respectively. In the second frame, only data with colour temperatures below 14 K are used.
Current usage metrics show cumulative count of Article Views (full-text article views including HTML views, PDF and ePub downloads, according to the available data) and Abstracts Views on Vision4Press platform.
Data correspond to usage on the plateform after 2015. The current usage metrics is available 48-96 hours after online publication and is updated daily on week days.
Initial download of the metrics may take a while.