Fig. 5
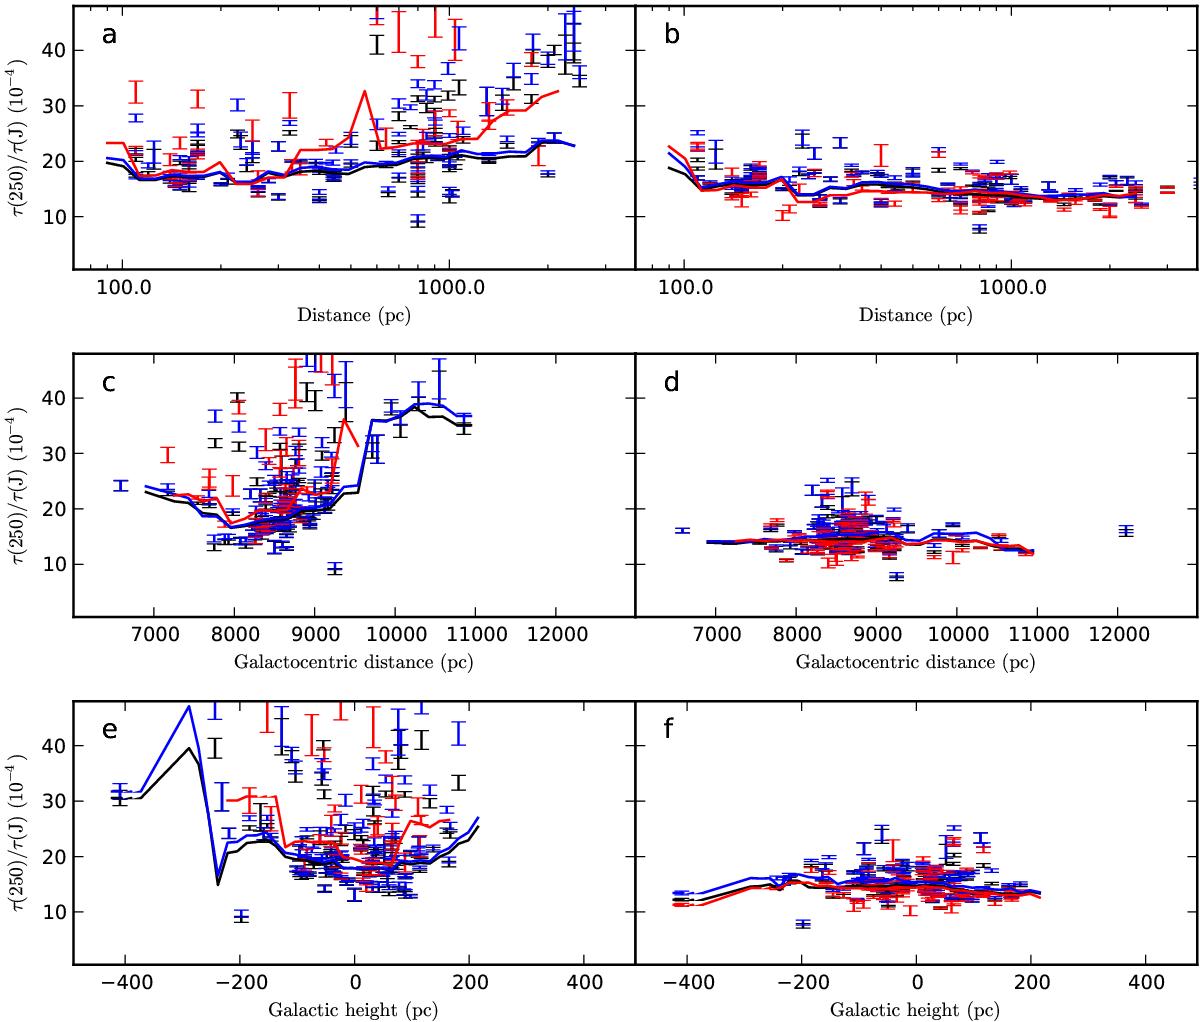
Slope values k = τ(250 μm)/τ(J) of Fig. 2 as a function of estimated distance (frames a), b)), galactocentric distance (frames c), d)), and galactic height (frames e), f)). Left frames: original slopes, right frames: slopes after the bias corrections of τ(250 μm) and τ(J). The black, blue, and red colours correspond to the full τ(J) range and to data below and above τ(J) = 0.6, respectively. The solid curves with the same colours are the weighted moving averages (window sizes 30% in distance, 800 pc in Galactocentric distance, and 100 pc in Galactic height). All τ(250 μm) values are calculated with SPIRE bands alone.
Current usage metrics show cumulative count of Article Views (full-text article views including HTML views, PDF and ePub downloads, according to the available data) and Abstracts Views on Vision4Press platform.
Data correspond to usage on the plateform after 2015. The current usage metrics is available 48-96 hours after online publication and is updated daily on week days.
Initial download of the metrics may take a while.