Fig. 3
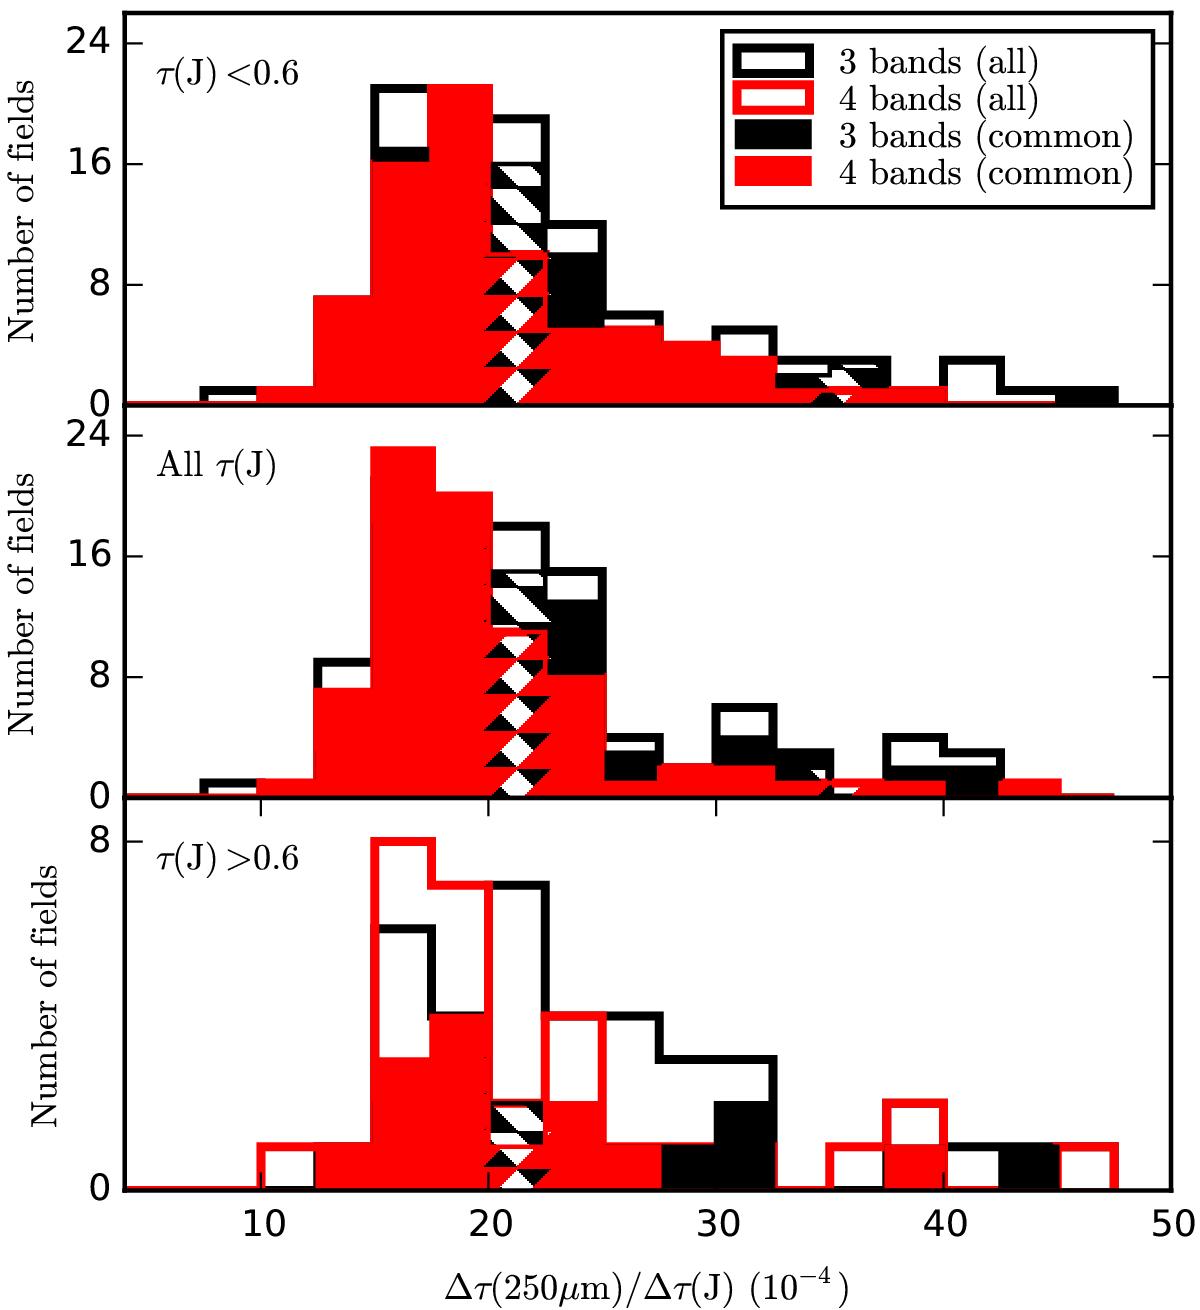
Comparison of Δτ(250 μm)/Δτ(J) values in three τ(J) intervals (three frames), obtained using either three of four Herschel bands in deriving the τ(250 μm) values. The two histograms without hatching (thick outlines) show all fields where the estimated uncertainty is below 10%. The two hatched histograms contain only the intersection with better than 10% accuracy with both three and four bands (79, 83, and 14 fields for the three panels, respectively).
Current usage metrics show cumulative count of Article Views (full-text article views including HTML views, PDF and ePub downloads, according to the available data) and Abstracts Views on Vision4Press platform.
Data correspond to usage on the plateform after 2015. The current usage metrics is available 48-96 hours after online publication and is updated daily on week days.
Initial download of the metrics may take a while.