Fig. 2
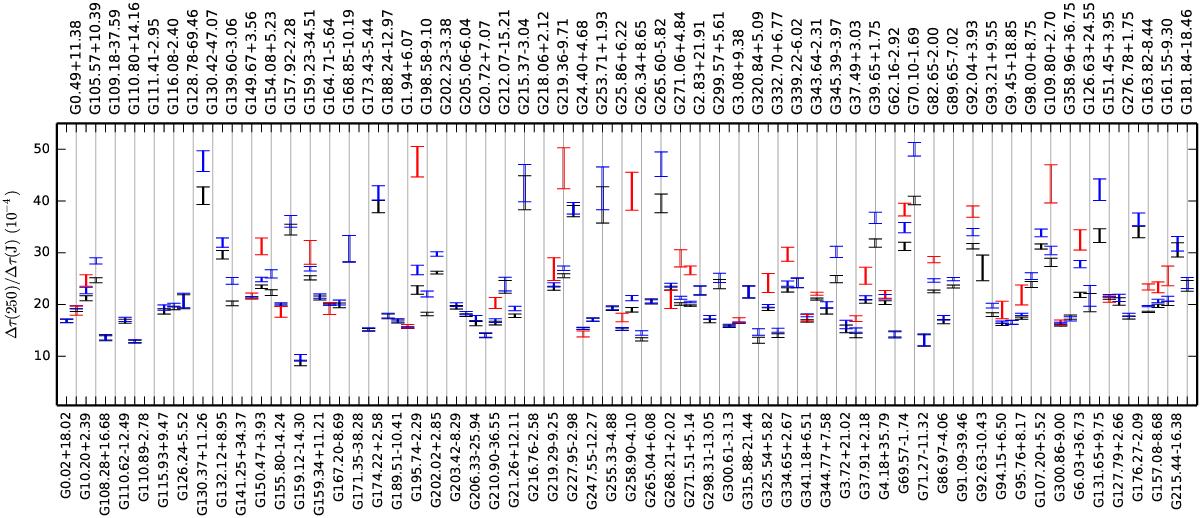
Slopes k = Δτ(250 μm)/Δτ(J) for all cases with uncertainties δk/k< 0.1. The black, blue, and red symbols correspond to values derived for the full τ(J) range and for data below and above the limit of τ(J) = 0.6. The values of τ(250 μm) have been derived from SPIRE data without the subtraction of the local background. Neither τ(250 μm) nor τ(J) has been corrected for the expected bias.
Current usage metrics show cumulative count of Article Views (full-text article views including HTML views, PDF and ePub downloads, according to the available data) and Abstracts Views on Vision4Press platform.
Data correspond to usage on the plateform after 2015. The current usage metrics is available 48-96 hours after online publication and is updated daily on week days.
Initial download of the metrics may take a while.