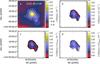
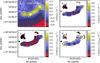
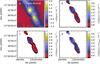
Fig. E.1
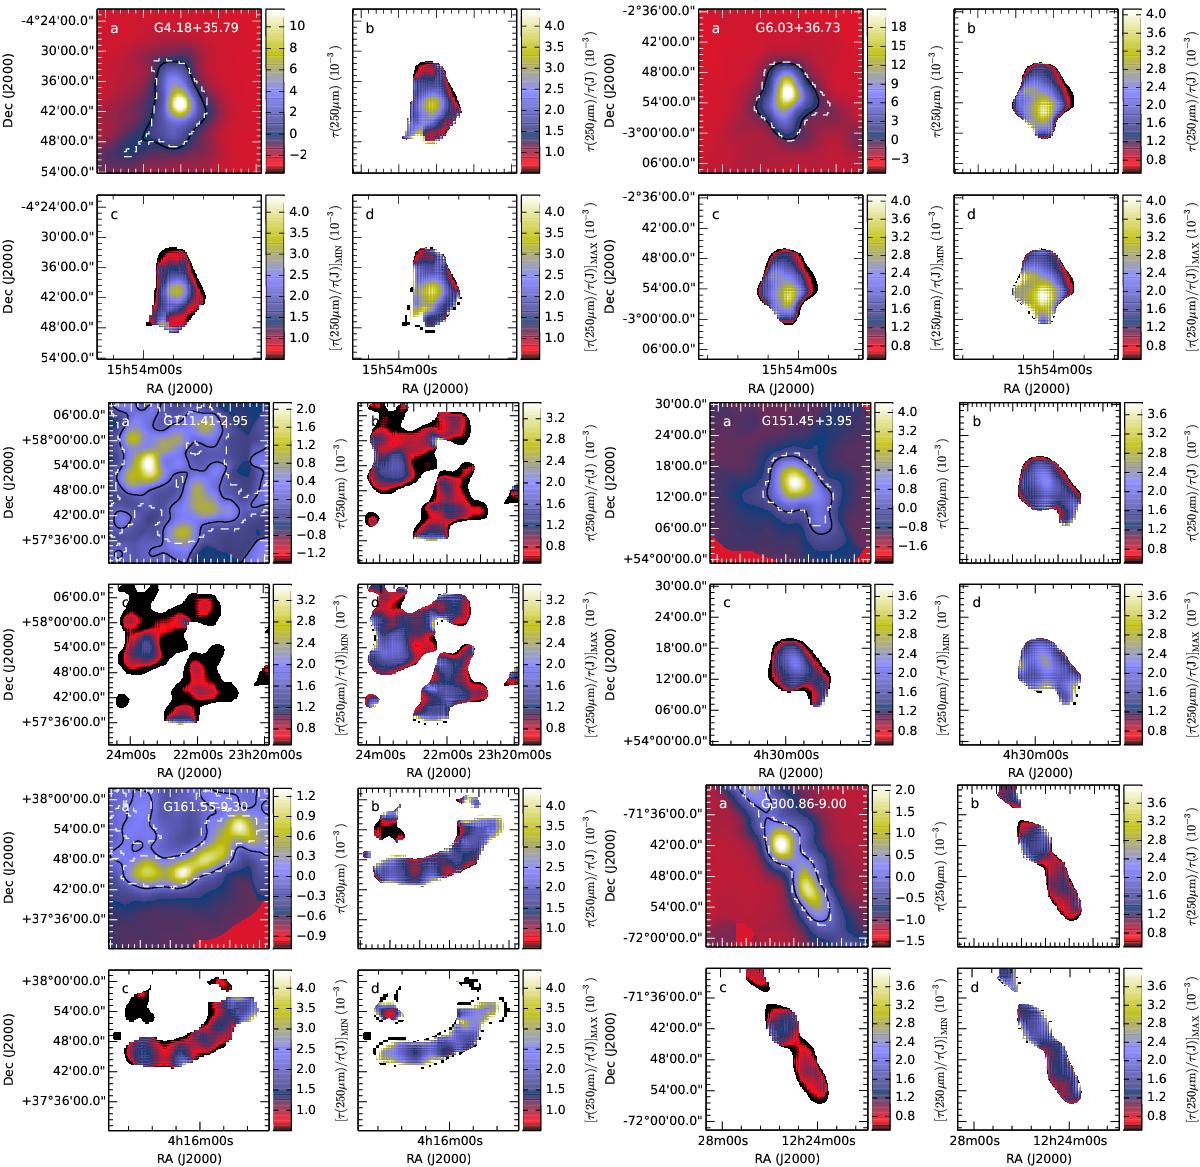
Maps of τ(250 μm) /τ(J) for the selected fields. Upper frames: τ(250 μm) (frame a)) and the ratio τ(250 μm) /τ(J). Lower frames: the lower (frame c)) and upper (frame d)) limits of τ(250 μm) /τ(J) calculated as (τ(250 μm) + δτ(250 μm))/(τ(J)−Δτ(J)) and (τ(250 μm)−δτ(250 μm))/(τ(J) + Δτ(J)) where δτ(250 μm) is the error map of τ(250 μm) and Δτ(J) is the estimated uncertainty of the τ(J) zero point. The areas in which the SN of either variable drops below 0.5 have been masked. In the first frame, the black contour corresponds to τ(250 μm) = δτ(250 μm) and the dashed white contour to τ(J) = Δτ(J).
Current usage metrics show cumulative count of Article Views (full-text article views including HTML views, PDF and ePub downloads, according to the available data) and Abstracts Views on Vision4Press platform.
Data correspond to usage on the plateform after 2015. The current usage metrics is available 48-96 hours after online publication and is updated daily on week days.
Initial download of the metrics may take a while.