Fig. C.1
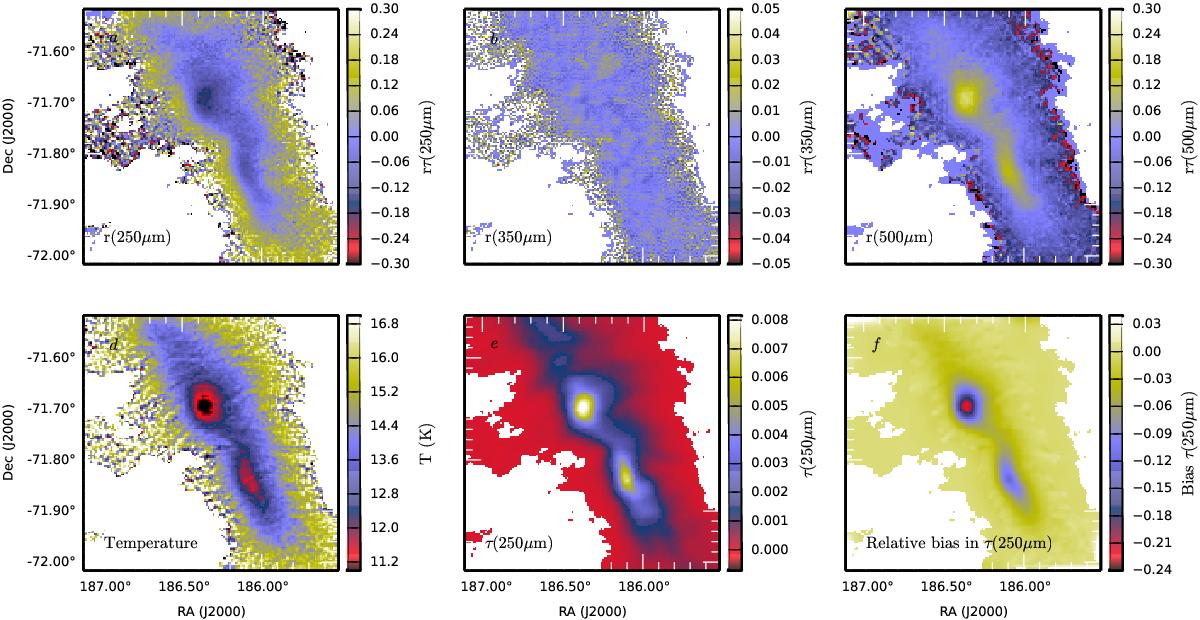
Field G300.86-9.00 as an example of the τ(250 μm) bias estimation with radiative transfer modelling. Upper row: relative error between the model predicted surface brightness and the observations at 250 μm, 350 μm, and 500 μm. Lower frames: colour temperature and τ(250 μm) maps calculated from the synthetic observations and the relative bias in τ(250 μm) obtained by comparison with the actual τ(250 μm) values in the model.
Current usage metrics show cumulative count of Article Views (full-text article views including HTML views, PDF and ePub downloads, according to the available data) and Abstracts Views on Vision4Press platform.
Data correspond to usage on the plateform after 2015. The current usage metrics is available 48-96 hours after online publication and is updated daily on week days.
Initial download of the metrics may take a while.