Fig. B.1
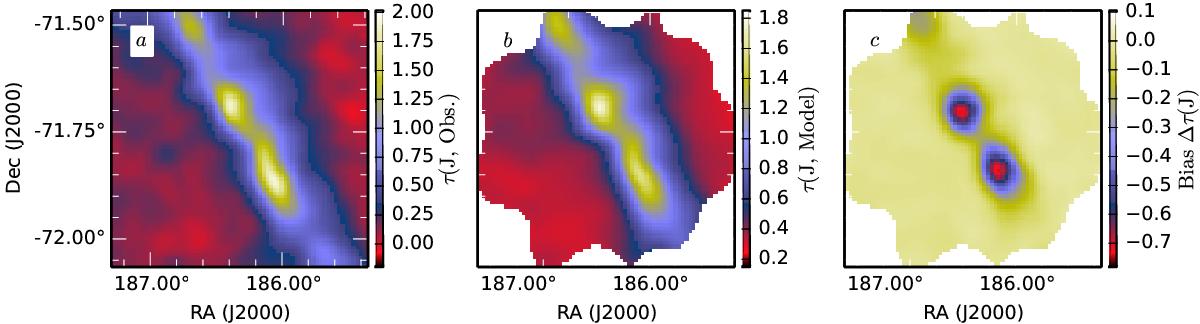
Field G300.86-9.00 as an example of τ(J) bias maps estimated with simulated NICER observations. The frames show the optical depth derived from actual observations (frame a)), average recovered extinction map in simulations (frame b)), and the bias as the difference between the output and input maps in the simulation (frame c)).
Current usage metrics show cumulative count of Article Views (full-text article views including HTML views, PDF and ePub downloads, according to the available data) and Abstracts Views on Vision4Press platform.
Data correspond to usage on the plateform after 2015. The current usage metrics is available 48-96 hours after online publication and is updated daily on week days.
Initial download of the metrics may take a while.