Fig. 11
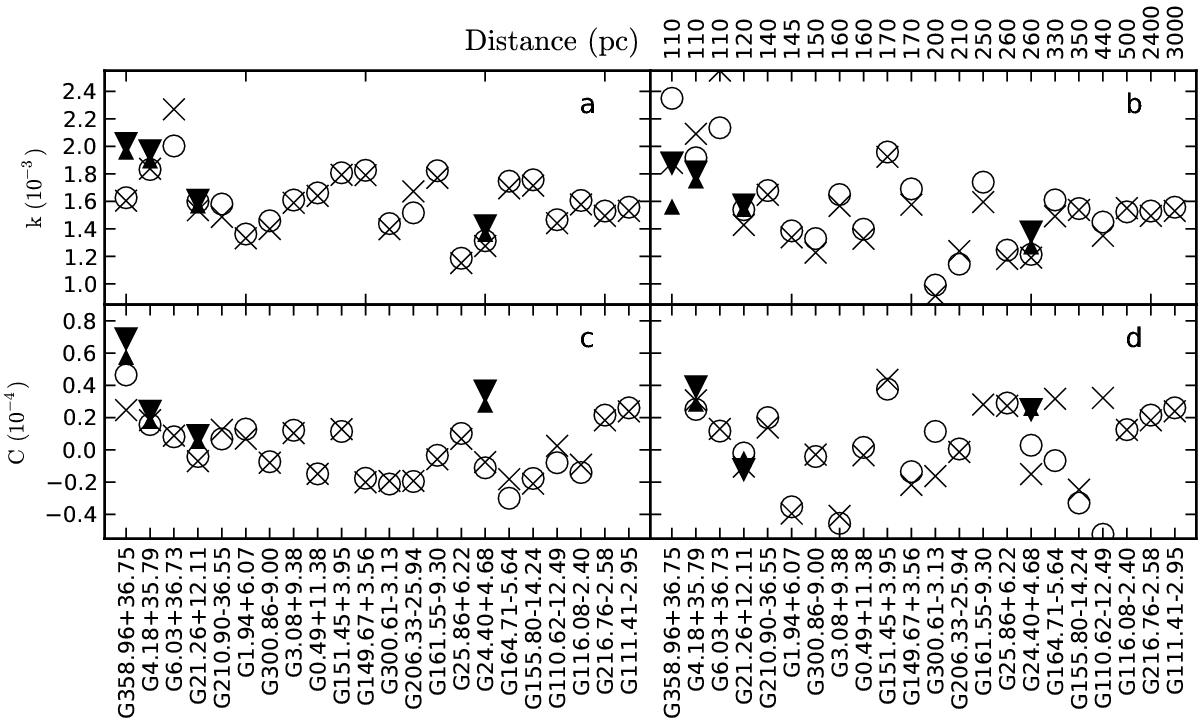
Comparison of parameters k (upper frames) and C (lower frames) obtained with data at resolutions of 180″ and 120″. Frames a) and c) show fits to all data, frames b) and d) fits to values τ(J) > 0.6 alone. The open circles and crosses show the estimates obtained with 2MASS data at resolutions of 180″ and 120″. The filled triangles show the results for VISTA observations, the larger triangles corresponding to a resolution of 180″, the smaller to a resolution of 120″. The fields are the same as in Fig. 9, with the addition of G358.96+36.75, which has fewer data points above τJ> 0.6 and for which parameter C could not be fitted with extinction maps with a resolution of 120″.
Current usage metrics show cumulative count of Article Views (full-text article views including HTML views, PDF and ePub downloads, according to the available data) and Abstracts Views on Vision4Press platform.
Data correspond to usage on the plateform after 2015. The current usage metrics is available 48-96 hours after online publication and is updated daily on week days.
Initial download of the metrics may take a while.