Fig. 10
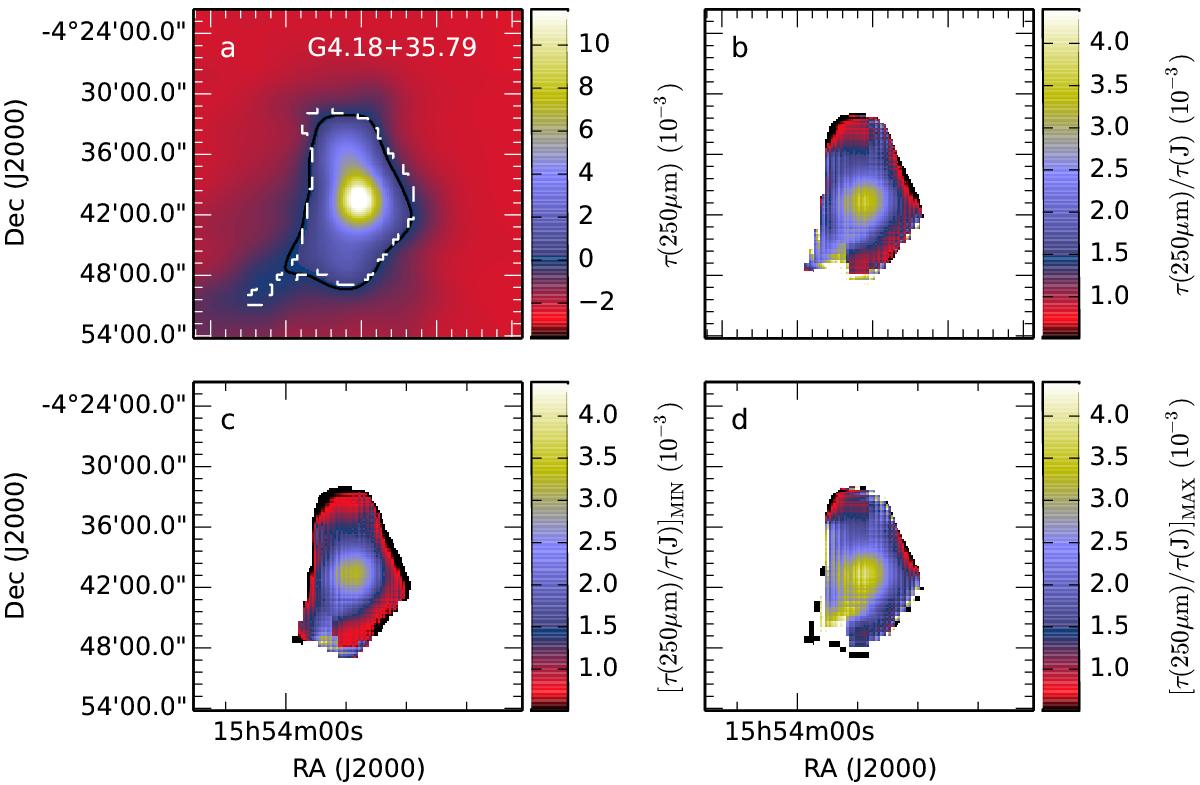
Field G4.18+35.79 (LDN 134). Upper frames: τ(250 μm) (frame a)) and the ratio τ(250 μm) /τ(J) (frame b)). The lower frames show the lower (frame c)) and upper (frame d)) limits of τ(250 μm) /τ(J) calculated as (τ(250 μm) + δτ(250 μm))/(τ(J)−δτ(J)) and (τ(250 μm)−δτ(250 μm))/(τ(J) + δτ(J)). The areas not covered by Herschel observations and regions with a SN below 0.5 have been masked. In frame a), the solid black contour and the dashed white contour correspond to τ(250 μm = δτ(250 μm) and τ(J) = δτ(J). The maps have a resolution of 180″ and τ(J) is derived using 2MASS data.
Current usage metrics show cumulative count of Article Views (full-text article views including HTML views, PDF and ePub downloads, according to the available data) and Abstracts Views on Vision4Press platform.
Data correspond to usage on the plateform after 2015. The current usage metrics is available 48-96 hours after online publication and is updated daily on week days.
Initial download of the metrics may take a while.