Fig. 9
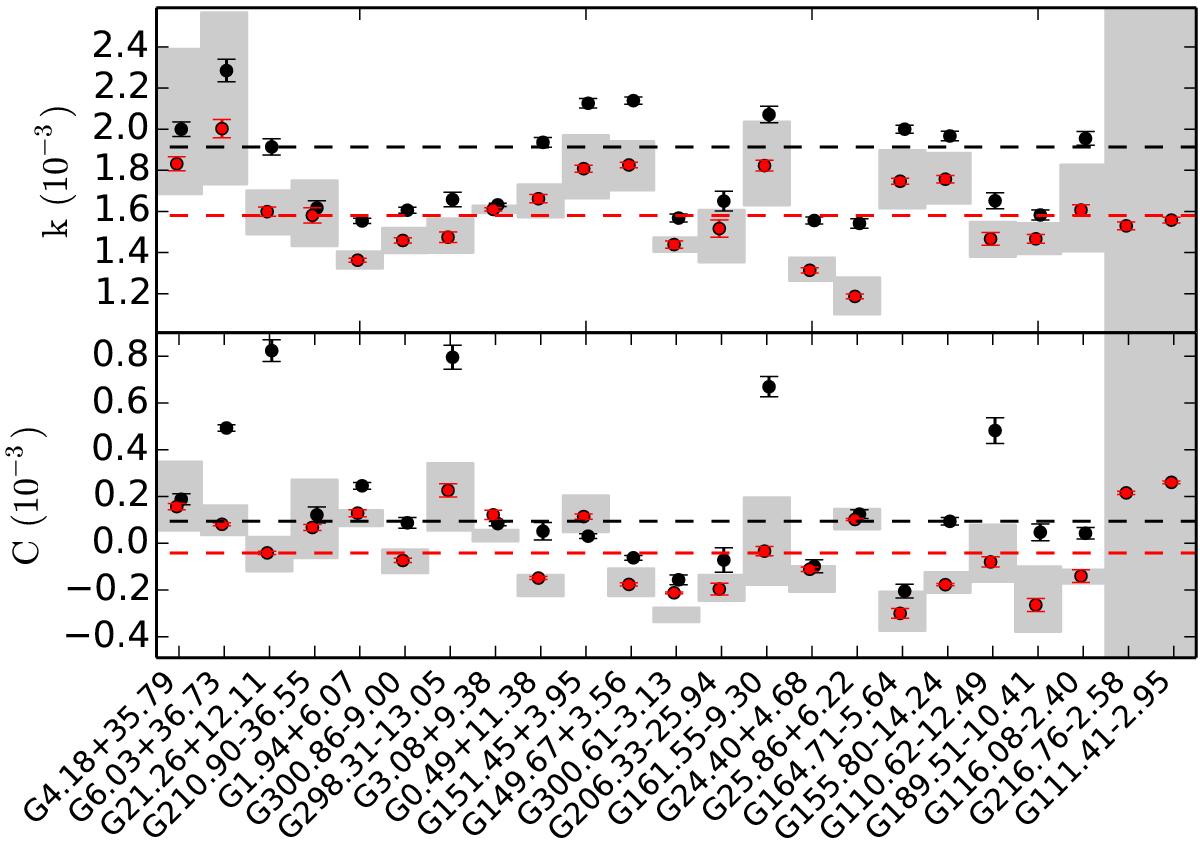
Linear slope k (upper frame) and the parameters C (lower frame) for the 23 selected fields. The values obtained without bias corrections are shown with black symbols. The values obtained with corrected τ(J) and τ(250 μm) data are shown with red symbols, the shaded area corresponding to the uncertainty of the bias correction that is due to the uncertainty of the distance estimates. The dashed lines show the median values corresponding to the black and red symbols. The fields are arranged in order of increasing distance, and the τ(250 μm) values are based on SPIRE data alone.
Current usage metrics show cumulative count of Article Views (full-text article views including HTML views, PDF and ePub downloads, according to the available data) and Abstracts Views on Vision4Press platform.
Data correspond to usage on the plateform after 2015. The current usage metrics is available 48-96 hours after online publication and is updated daily on week days.
Initial download of the metrics may take a while.