| Issue |
A&A
Volume 583, November 2015
|
|
|---|---|---|
| Article Number | L2 | |
| Number of page(s) | 4 | |
| Section | Letters | |
| DOI | https://doi.org/10.1051/0004-6361/201527317 | |
| Published online | 02 November 2015 | |
The long X-ray tail in Zwicky 8338
Argelander-Institut für Astronomie, Universität Bonn, Auf dem Hügel 71, 53121 Bonn, Germany
e-mail: gerrit@uni-bonn.de
Received: 6 September 2015
Accepted: 8 October 2015
The interaction processes in galaxy clusters between the hot ionized gas (ICM) and the member galaxies are of crucial importance to understand the dynamics in galaxy clusters, the chemical enrichment processes, and the validity of their hydrostatic mass estimates. Recently, several X-ray tails associated with gas that was partly stripped of galaxies have been discovered. We report on the X-ray tail in the 3 keV galaxy cluster Zwicky 8338, which might be the longest galaxy-scale stripping process ever observed. We derive the properties of the galaxy cluster environment and give hints on the substructure present in this X-ray tail, which is very likely associated with the galaxy CGCG254-021. The X-ray tail is extraordinarily luminous (2 × 1042 erg s-1), the thermal emission has a temperature of 0.8 keV, and the X-ray luminous gas might be stripped off completely from the galaxy. From assumptions about the 3D geometry, we estimate the gas mass fraction (<0.1%) and conclude that the gas has been compressed and/or heated.
Key words: galaxies: clusters: individual: Zwicky 8338 / galaxies: clusters: intracluster medium / X-rays: galaxies: clusters
© ESO, 2015
1. Introduction
Galaxy clusters are important tools for cosmology. They consist of galaxies, the intracluster medium (ICM), which is a very hot plasma (several 107 K), and dark matter. This hot gas is emitting mainly line and free-free emission in X-rays. Although the ICM undergoes many processes that affect the composition and thermal structure, a simplistic assumption is to treat galaxy clusters as relaxed objects. Understanding all these processes, which play a key role in the evolution, is essential to obtain robust constraints on parameters, such as, gas and total mass. One important process to look at is the infall and dynamics of member galaxies as initially described by Gunn & Gott (1972). Halo gas and the cold inter stellar medium (ISM) from the galaxy can then be stripped off and interact with the ICM. Part of the gas from the galaxy is then used for new stars, either in the galactic halo or outside the galaxy in the ICM (see, e.g., Sun et al. 2007). Simulations of the interaction between ISM and ICM (e.g., Stevens et al. 1999; Kapferer et al. 2009; Steinhauser et al. 2012; Roediger et al. 2015) predict a leading bow shock and tail behind the galaxy, which are both visible in X-rays. The highest chance to find these structures is in cool nearby clusters with blue galaxies. Since an X-ray counterpart is not always found when, e.g., an HI tail is detected (see Oosterloo & van Gorkom 2005), the process of stripping off gas from the host galaxy is still not understood completely and should be analyzed in more detail. Unfortunately only very few detections in X-rays have been made so far (e.g., Wang et al. 2004; Sun & Vikhlinin 2005; Machacek et al. 2005; Sun et al. 2006; Randall et al. 2008; Kim et al. 2008). The interaction of the ICM with subclusters or galaxy groups can also produce X-ray bright and long tails (e.g., Reiprich et al. 2004; Eckert et al. 2014).
In our short Chandra observation of the galaxy cluster Z8338, we identify a member galaxy exhibiting a very long X-ray tail (at least 76 kpc length). It turns out that this object is already listed in the ROSAT catalog (Voges et al. 1999) as 1RXS J181030.0+495615. The projected distance of this galaxy from the main cluster center is 310 kpc. Surprisingly, the galaxy has probably lost all of its X-ray emitting gas very recently. The peak of the emission is 40 kpc offset from the galaxy center, so clearly this has never been seen before. Moreover, we see hints of a bow shock because of an increased temperature in a region in front of the X-ray tail. Here, we present the parameters, such as the thermodynamic structure, derived from the short observation of this very long and bright tail. It is likely the longest X-ray tail associated with a stripping process from a galaxy with the largest separation from the host galaxy ever detected. We assume a ΛCDM cosmology, with Ωm = 0.3, ΩΛ = 0.7 and H0 = 71 km s-1 Mpc-1, to be consistent with Piffaretti et al. 2011(P11). All uncertainties are at the 68% confidence level.
2. Data analysis and results
For the following analysis, the CIAO Software package 4.7 and CALDB 4.6.7, as well as the HEASOFT tools 6.17 including Xspec 12.9 (Arnaud 1996), were used. Since we are dealing with regions of few counts, we use the Xspec implemented C-statistics (Cash 1979). For each spectral fit, we verified our parameter estimates and degeneracies by performing an MCMC within Xspec, so all derived quantities, such as the luminosity, were calculated using the distributions of the source parameters (temperature, abundance, normalization, and in some cases redshift). The steps for the data reduction follow the same structure as described in Schellenberger et al. (2015). The solar abundances are set to the values given by Asplund et al. (2009). The influence of the abundance table, especially at lower plasma temperatures on the best-fit parameters, are shown, e.g., in Lovisari et al. (2015).
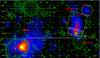 |
Fig. 1 Adaptively smoothed X-ray image with V-band contours from WINGS (Fasano et al. 2006) in green. The distance of the “Comet” from the cluster center (Z8338) is 5.3′ (310 kpc). The tail of the “Comet” has roughly a length of 1.3′ (76 kpc). Two close member galaxies (CGCG254-021 and J181025.63) are labeled as well; we assume that the comet-shaped X-ray emission is due to gas stripped from CGCG254-021. |
2.1. The cluster
The galaxy cluster of interest for this work is listed in P11 with the following basic properties:
-
The name is given as ZwCl8338 or MCXC J1811.0+4954.
-
The equatorial coordinates are RA = 272.7504 °, Dec = 49.9111 ° (J2000).
-
L500 = 5.3 × 1043 erg s-1 in the 0.1−2.4 keV energy band, which corresponds to 3.4 × 1043 erg s-1 in 0.5−2 keV band.
-
M500 = 1.3 × 10¹⁴M⊙.
-
R500 = 0.767 Mpc.
-
Redshift z = 0.0501 (as given in Böhringer et al. 2000).
While analyzing our 8 ks Chandra observation from Observation Cycle 14 (OBSID 15163) pointed at this cluster, we discovered a comet-like structure to the west (Fig. 1).
Analyzing the cluster Z8338 itself by extracting spectra reveals some details about the ICM environment. In the following, the ICM emission is described by an apec-model (AtomDB 2.0.2) combined with a phabs-model to account for the Galactic absorption (NH = 4.8 × 1020 cm-2, Willingale et al. 2013). Several regions around the cluster center (excluding point sources and the Comet) are fitted (see Table 1).
Temperature, abundance of heavy elements, and luminosity for the cluster in different regions using a redshift of 0.05.
Leaving the redshift free to vary in a region with high signal-to-noise, we constrain  , which is consistent with P11. Also, the calculated luminosity within 77% R500 deviates by only 17% from the value in P11. For the calculation of our luminosities point sources and the Comet structure have been excluded, while this is not the case in P11. The core region of the cluster shows a significant drop in temperature. We find a cluster temperature in the annulus, which comprises the “Comet”, of 3.6(4) keV. Compared with the inner and outer regions of the cluster, this seems to be significantly higher. If one splits this annulus into one east and one west sector, the latter including the region around the Comet, we detect consistent temperatures and abundances in these two sectors.
2.2. The “Comet”
The structure to the west (referred to as Comet) consists of a brighter spot to the south (referred to as Head) and an elongated structure of diffuse emission (referred to as Main tail). Estimating the length of the structure by eye from the smoothed image shown in Fig. 1, we conclude a size of 1.2′, which corresponds to 70.5 kpc using the cluster redshift of 0.05. By extracting a profile (from equal sized boxes of 10′′ width) along the tail from the (unsmoothed) exposure corrected counts image (Fig. 2), we are able to fit the function 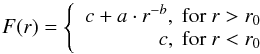 (1)to the photon flux, where a, b, c, and r0 are free parameters. With the same redshift, we find a length of 143, 98 or 76 kpc when the function reaches at c plus 1σ, 2σ, or 3σ, respectively. The flux increase in Fig. 2 at around (260–280) arcsec (the red dashed line) corresponds to the light peak labeled “Outside” in Fig. 1. This could imply that the Comet consists of substructure and its total length extends beyond 150 kpc. In this region outside the main tail (Outside in Fig. 1) the temperature seems to be significantly higher than any part of the tail (Table 2), but still much lower than in the surrounding cluster region.
Unfortunately this structure has only around 300 source counts in this observation, so it is hard to derive any detailed properties. Still we are able to obtain rough estimates for the properties of the Comet, given in Table 2. As a result of the lower temperature, we decided to perform the spectral fits related to the Comet in the (0.53) keV band. It turns out that the head is (with low significance) cooler than the tail, possibly due to a dense cool core. Overall, when accounting for the projected cluster emission, the Comet exhibits a temperature 0.77(8) keV and a luminosity in the (0.5–2) keV band of 2.0(2) × 1042 erg s-1. These properties are consistent with the expectations for X-ray tails (e.g., Sun et al. 2006), only the luminosity is almost one order of magnitude higher. Despite the large uncertainties, there might be indications that the tail has a much lower abundance of heavy elements than the head of the Comet, which is again consistent with the head being the remnant of a cool core.
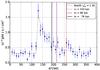 |
Fig. 2 Photon flux profile across the Comet structure from south to north. |
We tried to determine the redshift from the spectrum with the highest count number and got a value ( ) consistent with that from the cluster spectrum, so we assume that the Comet is interacting with the ICM of Z8338. Also, comparing the measured X-ray flux of the Comet with those of small galaxy groups using the L−T relation from Lovisari et al. (2015), we conclude a redshift range
  , which also excludes this structure from being a background cluster.
Having the gas properties, such as X-ray luminosity and temperature as well as the redshift of the Comet in hand, one can calculate the gas mass assuming a 3D shape. Since the information on the properties has large uncertainties and to obtain a rough estimate, we assume a cylindrical shape with 1.2′ height and 0.15′ radius. We calculate 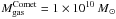 . Assuming the Comet is a small galaxy group, one can use a scaling relation to convert the X-ray luminosity into the total mass at the structure the Comet used to reside in, assuming it has been stripped. With the bias corrected L−M relation for galaxy groups from Lovisari et al. (2015), we estimate a total mass for the Comet structure of
  and a gas mass fraction of 0.04%. We estimate
  and a gas mass fraction of 0.06% with the M−T relation from the same reference. For a total mass in this range, a gas mass fraction of 3−7% is expected (Lovisari et al. 2015). Even when we dramatically increase our rough estimates for the cylinder (radius × 2, height × 1.5), we still get an upper limit for the gas mass fraction of ~0.1%. These values indicate that this object is far too luminous and hot than what is expected for its size. This could indicate that the gas is compressed, e.g., by tidal ram pressure stripping processes, or heated by shocks or compression. However, assuming that the gas originally was attached to a small galaxy group and now almost completely left the gravitational potential, it is expected that at least the outer parts of it undergo adiabatic expansion. This would not only cool down the gas, but also lower its density, making it more difficult to detect X-rays resulting in both an underestimated gas mass and underestimated luminosity and total mass.
With the use of the spectrum of our observation of the cluster in the (4–7)′ annulus, we can roughly estimate the pressure, 5.4(6) × 10-12 erg cm-3, and density, 8.0(3) × 10-28 g cm-3, around the Comet. Simulations in Kapferer et al. (2009) show that for a relative velocity between the surrounding gas and the galaxy of vrel = 1000 km s-1 and pressure that is eight times higher and surrounding density that is six times higher, the scenario of a completely stripped gaseous disk can be explained. This might be a hint that the relative velocity of the galaxy is significantly larger. Owing to the very low number of counts, we find an interesting but weak hint from a spectral analysis that there might be a high temperature region in front of the Comet. A test to mirror the same region on the other side of the cluster strengthens this hypothesis since there we measure a temperature consistent with that in this cluster annulus (Table 1). Unfortunately, we are not able to detect a surface brightness enhancement connected to the hypothesized bow shock region, which in turn weakens this idea.
Best-fit temperature, relative abundance of heavy elements, X-ray luminosity, and signal-to-noise ratio using a redshift of 0.0501.
3. Counterparts in other wavelengths
We find galaxies in the vicinity of this structure with publicly available image data from the Wide-field Infrared Survey Explorer (WISE, Wright et al. 2010) and the WINGS survey (Fasano et al. 2006; Varela et al. 2009; Valentinuzzi et al. 2009) : To the south we can identify the 14.126 magV galaxy CGCG254-021 (also called J181029.20+495517.0; Fritz et al. 2011, F11) with a stellar mass of 1.36(1) × 1012M⊙, which seems unusually high. This galaxy is listed as a member galaxy of Z8338 (Smith et al. 2004; and a spectroscopic redshift of 0.0511 in Cava et al. 2009, in agreement with the cluster redshift in P11). According to F11, this is the galaxy with the highest mass, by far the highest star formation (SF) rate in the past (5.5 M⊙/ yr, while no SF is detected in current age), and the highest age within Z8338. Hence, this galaxy was a large starburst galaxy and is now clearly dominant over other objects in Z8338 in the region around the Comet.
With the colors (B−V) = 1.1 and (U−B) = 0.95 (Varela et al. 2009; Omizzolo et al. 2014) the galaxy CGCG254 is clearly an early-type galaxy (de Vaucouleurs 1961). Since the bolometric X-ray luminosity compared to the B-band luminosity seems to agree with what is expected for BCGs, as shown by O’Sullivan et al. (2001), one can raise the assumption that the galaxy was the BCG of a galaxy group. Jeltema et al. (2008) have shown that also the X-ray and near-infrared (K-band) luminosity of early-type galaxies in clusters and groups are correlated. Applying their relation for clusters and using infrared data from 2MASS (Skrutskie et al. 2006) we find a predicted  , which is almost two orders of magnitude lower than measured. Instead, the predicted and measured X-ray luminosities are almost consistent when assuming that the galaxy is a field galaxy, which has not lost gas from the interaction with the cluster ICM.
In Fig. 1 we can also see that a cone at the end of the head (region “Head” in Fig. 1) of the structure is pointing toward the galaxy. The galaxy has a radio counterpart visible in the NVSS image (Condon et al. 1998, Fig. 3). Interpreting qualitatively the radio morphology as due to bent lobes of the radio AGN at the center of CGCG254, the inferred direction of motion (south) is consistent with that inferred from the X-ray morphology at the Comet. Unfortunately, the radio signal is very weak (1.7 and 4.6σ), so this assertion needs a deeper radio observation to be confirmed. The optical/N-IR source to the south west of the Comet is a galaxy (J181025.63+495541.7) with a V-band magnitude of 16.6 (see Varela et al. 2009) and a redshift of z = 0.051 (Smith et al. 2004), so this galaxy most likely belongs to the cluster but we see no indications of interaction with it or the Comet or CGCG254.
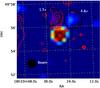 |
Fig. 3 21 cm-Radio continuum from NVSS showing two possible bent radio lobes qualitatively, which follow the expected direction of motion from the X-ray morphology (red). The significance of the possible detections are indicated. |
Compared to the 70 kpc X-ray tail of a galaxy analyzed in Sun et al. (2006), this X-ray tail is about 20 times more luminous. The Chandra ACIS-I count-rate for our object is 40% higher than that of the X-ray tail in Sun et al. (2006), while the two objects have a very similar temperature structure. This means the amount of gas that apparently has been stripped of the galaxy is very high, or the galaxy lost almost all of its gas to the ICM. If this scenario was confirmed by the analysis of a longer observation, one would have the chance to study in detail the properties of this interaction for such a luminous and massive object.
4. Conclusion
In our short Chandra observation of Zwicky 8338, we identify a long X-ray tail, of which we study the properties. We measure the surrounding ICM to have a temperature of 3.6(4) keV. The X-ray tail itself shows thermal emission with a temperature of 0.77 keV. Indications point to a head-tail structure within the X-ray tail: a cooler, but more metal rich part has a very peaked brightness distribution, while the other part is more diffuse.
The 14 magV galaxy CGCG254-021 is very close to this X-ray object and several indications point to the scenario that the X-ray tail is stripped gas from this galaxy or from a small galaxy group with this galaxy as its BCG:
-
The projected distance between the peak of the X-ray tail and thegalaxy center is only 40 kpc.
-
The redshift of galaxy and X-ray tail are consistent with the cluster redshift.
-
The apparently bent radio lobes from the galaxy’s AGN are consistent with the inferred direction of motion.
-
The galaxy is the brightest galaxy within this region with the highest star formation rate in the past.
-
The tail’s gas mass inferred from the X-ray luminosity is far too low for its estimated total mass, if one compares these values with galaxy group scaling relations.
-
The stellar mass of the galaxy is consistent with those of BCGs in galaxy groups.
With a deeper X-ray observation, it would be possible to characterize more detailed properties as well as a definite scenario for the interaction history.
Acknowledgments
The authors would like to thank Sandra Burkutean, Alberto Doria, and Lorenzo Lovisari for helpful discussions. G.S., T.H.R. acknowledge support by the German Research Association (DFG) through grant RE 1462/6. G.S. acknowledges support by the Bonn-Cologne Graduate School of Physics and Astronomy (BCGS). T.H.R. acknowledges support by the DFG through Heisenberg grant RE 1462/5.
References
- Arnaud, K. A. 1996, in Astronomical Data Analysis Software and Systems V, eds. G. H. Jacoby, & J. Barnes, ASP Conf. Ser., 101, 17 [Google Scholar]
- Asplund, M., Grevesse, N., Sauval, A. J., & Scott, P. 2009, ARA&A, 47, 481 [NASA ADS] [CrossRef] [Google Scholar]
- Böhringer, H., Voges, W., Huchra, J. P., et al. 2000, ApJS, 129, 435 [NASA ADS] [CrossRef] [Google Scholar]
- Cash, W. 1979, ApJ, 228, 939 [NASA ADS] [CrossRef] [Google Scholar]
- Cava, A., Bettoni, D., Poggianti, B. M., et al. 2009, A&A, 495, 707 [NASA ADS] [CrossRef] [EDP Sciences] [Google Scholar]
- Condon, J. J., Cotton, W. D., Greisen, E. W., et al. 1998, AJ, 115, 1693 [NASA ADS] [CrossRef] [Google Scholar]
- de Vaucouleurs, G. 1961, ApJS, 5, 233 [NASA ADS] [CrossRef] [Google Scholar]
- Eckert, D., Molendi, S., Owers, M., et al. 2014, A&A, 570, A119 [NASA ADS] [CrossRef] [EDP Sciences] [Google Scholar]
- Fasano, G., Marmo, C., Varela, J., et al. 2006, A&A, 445, 805 [NASA ADS] [CrossRef] [EDP Sciences] [Google Scholar]
- Fritz, J., Poggianti, B. M., Cava, A., et al. 2011, A&A, 526, A45 [NASA ADS] [CrossRef] [EDP Sciences] [Google Scholar]
- Gunn, J. E., & Gott, III, J. R. 1972, ApJ, 176, 1 [NASA ADS] [CrossRef] [Google Scholar]
- Jeltema, T. E., Binder, B., & Mulchaey, J. S. 2008, ApJ, 679, 1162 [NASA ADS] [CrossRef] [Google Scholar]
- Kapferer, W., Sluka, C., Schindler, S., Ferrari, C., & Ziegler, B. 2009, A&A, 499, 87 [NASA ADS] [CrossRef] [EDP Sciences] [Google Scholar]
- Kim, D.-W., Kim, E., Fabbiano, G., & Trinchieri, G. 2008, ApJ, 688, 931 [NASA ADS] [CrossRef] [Google Scholar]
- Lovisari, L., Reiprich, T. H., & Schellenberger, G. 2015, A&A, 573, A118 [NASA ADS] [CrossRef] [EDP Sciences] [Google Scholar]
- Machacek, M. E., Nulsen, P., Stirbat, L., Jones, C., & Forman, W. R. 2005, ApJ, 630, 280 [NASA ADS] [CrossRef] [Google Scholar]
- Omizzolo, A., Fasano, G., Reverte Paya, D., et al. 2014, A&A, 561, A111 [NASA ADS] [CrossRef] [EDP Sciences] [Google Scholar]
- Oosterloo, T., & van Gorkom, J. 2005, A&A, 437, L19 [NASA ADS] [CrossRef] [EDP Sciences] [Google Scholar]
- O’Sullivan, E., Forbes, D. A., & Ponman, T. J. 2001, MNRAS, 328, 461 [NASA ADS] [CrossRef] [Google Scholar]
- Piffaretti, R., Arnaud, M., Pratt, G. W., Pointecouteau, E., & Melin, J.-B. 2011, A&A, 534, A109 [NASA ADS] [CrossRef] [EDP Sciences] [Google Scholar]
- Randall, S., Nulsen, P., Forman, W. R., et al. 2008, ApJ, 688, 208 [NASA ADS] [CrossRef] [Google Scholar]
- Reiprich, T. H., Sarazin, C. L., Kempner, J. C., & Tittley, E. 2004, ApJ, 608, 179 [NASA ADS] [CrossRef] [Google Scholar]
- Roediger, E., Kraft, R. P., Nulsen, P. E. J., et al. 2015, ApJ, 806, 103 [NASA ADS] [CrossRef] [Google Scholar]
- Schellenberger, G., Reiprich, T. H., Lovisari, L., Nevalainen, J., & David, L. 2015, A&A, 575, A30 [NASA ADS] [CrossRef] [EDP Sciences] [Google Scholar]
- Skrutskie, M. F., Cutri, R. M., Stiening, R., et al. 2006, AJ, 131, 1163 [NASA ADS] [CrossRef] [Google Scholar]
- Smith, R. J., Hudson, M. J., Nelan, J. E., et al. 2004, AJ, 128, 1558 [NASA ADS] [CrossRef] [Google Scholar]
- Steinhauser, D., Haider, M., Kapferer, W., & Schindler, S. 2012, A&A, 544, A54 [NASA ADS] [CrossRef] [EDP Sciences] [Google Scholar]
- Stevens, I. R., Acreman, D. M., & Ponman, T. J. 1999, MNRAS, 310, 663 [NASA ADS] [CrossRef] [Google Scholar]
- Sun, M., & Vikhlinin, A. 2005, ApJ, 621, 718 [NASA ADS] [CrossRef] [Google Scholar]
- Sun, M., Jones, C., Forman, W., et al. 2006, ApJ, 637, L81 [NASA ADS] [CrossRef] [Google Scholar]
- Sun, M., Donahue, M., & Voit, G. M. 2007, ApJ, 671, 190 [NASA ADS] [CrossRef] [Google Scholar]
- Valentinuzzi, T., Woods, D., Fasano, G., et al. 2009, A&A, 501, 851 [NASA ADS] [CrossRef] [EDP Sciences] [Google Scholar]
- Varela, J., D’Onofrio, M., Marmo, C., et al. 2009, A&A, 497, 667 [NASA ADS] [CrossRef] [EDP Sciences] [Google Scholar]
- Voges, W., Aschenbach, B., Boller, T., et al. 1999, A&A, 349, 389 [NASA ADS] [Google Scholar]
- Wang, Q. D., Owen, F., & Ledlow, M. 2004, ApJ, 611, 821 [NASA ADS] [CrossRef] [Google Scholar]
- Willingale, R., Starling, R. L. C., Beardmore, A. P., Tanvir, N. R., & O’Brien, P. T. 2013, MNRAS, 431, 394 [NASA ADS] [CrossRef] [Google Scholar]
- Wright, E. L., Eisenhardt, P. R. M., Mainzer, A. K., et al. 2010, AJ, 140, 1868 [NASA ADS] [CrossRef] [Google Scholar]
All Tables
Temperature, abundance of heavy elements, and luminosity for the cluster in different regions using a redshift of 0.05.
Best-fit temperature, relative abundance of heavy elements, X-ray luminosity, and signal-to-noise ratio using a redshift of 0.0501.
All Figures
|
Fig. 1 Adaptively smoothed X-ray image with V-band contours from WINGS (Fasano et al. 2006) in green. The distance of the “Comet” from the cluster center (Z8338) is 5.3′ (310 kpc). The tail of the “Comet” has roughly a length of 1.3′ (76 kpc). Two close member galaxies (CGCG254-021 and J181025.63) are labeled as well; we assume that the comet-shaped X-ray emission is due to gas stripped from CGCG254-021. |
| In the text | |
|
Fig. 2 Photon flux profile across the Comet structure from south to north. |
| In the text | |
|
Fig. 3 21 cm-Radio continuum from NVSS showing two possible bent radio lobes qualitatively, which follow the expected direction of motion from the X-ray morphology (red). The significance of the possible detections are indicated. |
| In the text | |
Current usage metrics show cumulative count of Article Views (full-text article views including HTML views, PDF and ePub downloads, according to the available data) and Abstracts Views on Vision4Press platform.
Data correspond to usage on the plateform after 2015. The current usage metrics is available 48-96 hours after online publication and is updated daily on week days.
Initial download of the metrics may take a while.