Fig. 9
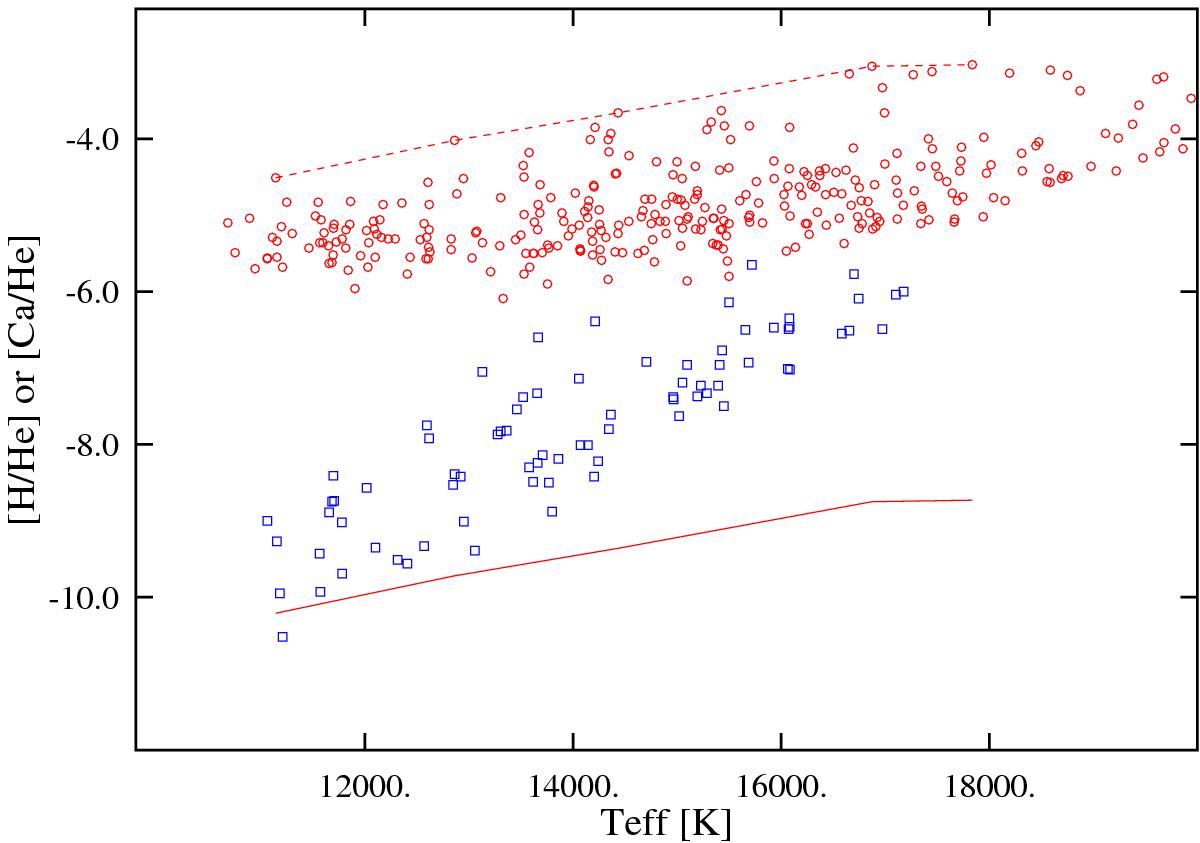
Hydrogen (red circles) and Ca (blue squares) abundance versus Teff. The red dotted line is an empirical upper limit to H abundances, drawn through those objects with the highest abundances. The continuous line is shifted downward by 5.7 dex, the solar H/Ca ratio. Stars with a solar or higher H/Ca would be found below this line, which is, however, below the visibility limit of Ca for all but the coolest stars.
Current usage metrics show cumulative count of Article Views (full-text article views including HTML views, PDF and ePub downloads, according to the available data) and Abstracts Views on Vision4Press platform.
Data correspond to usage on the plateform after 2015. The current usage metrics is available 48-96 hours after online publication and is updated daily on week days.
Initial download of the metrics may take a while.