Fig. 6
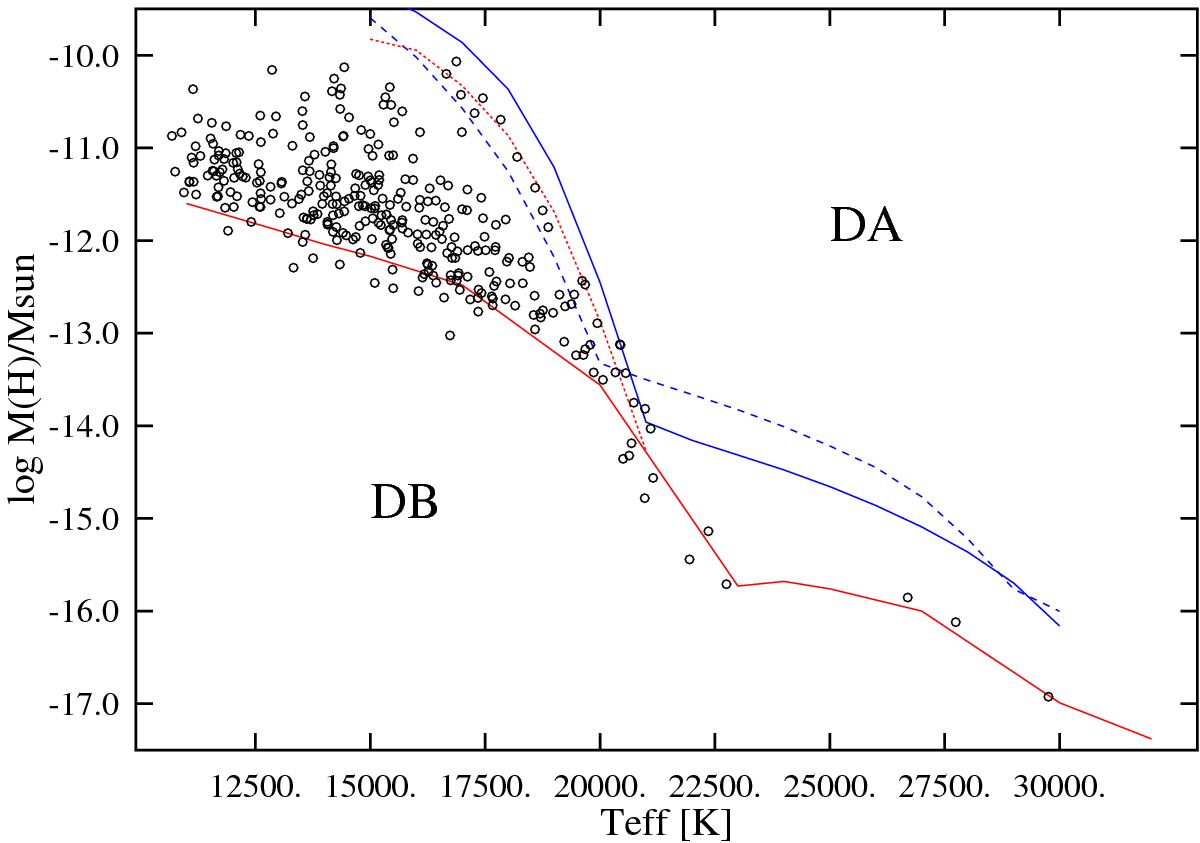
Total hydrogen mass in the convection zone. The continuous red line is the transformed lower limit to the positive detections in Fig. 2. The dotted red curve is the expected location for an abundance [H/He] = –3, which coincides with the continuous red curve at high temperatures. The blue curves indicate the expected hydrogen masses for abundances of −2 (continuous) or −1 (dotted).
Current usage metrics show cumulative count of Article Views (full-text article views including HTML views, PDF and ePub downloads, according to the available data) and Abstracts Views on Vision4Press platform.
Data correspond to usage on the plateform after 2015. The current usage metrics is available 48-96 hours after online publication and is updated daily on week days.
Initial download of the metrics may take a while.