Fig. 9
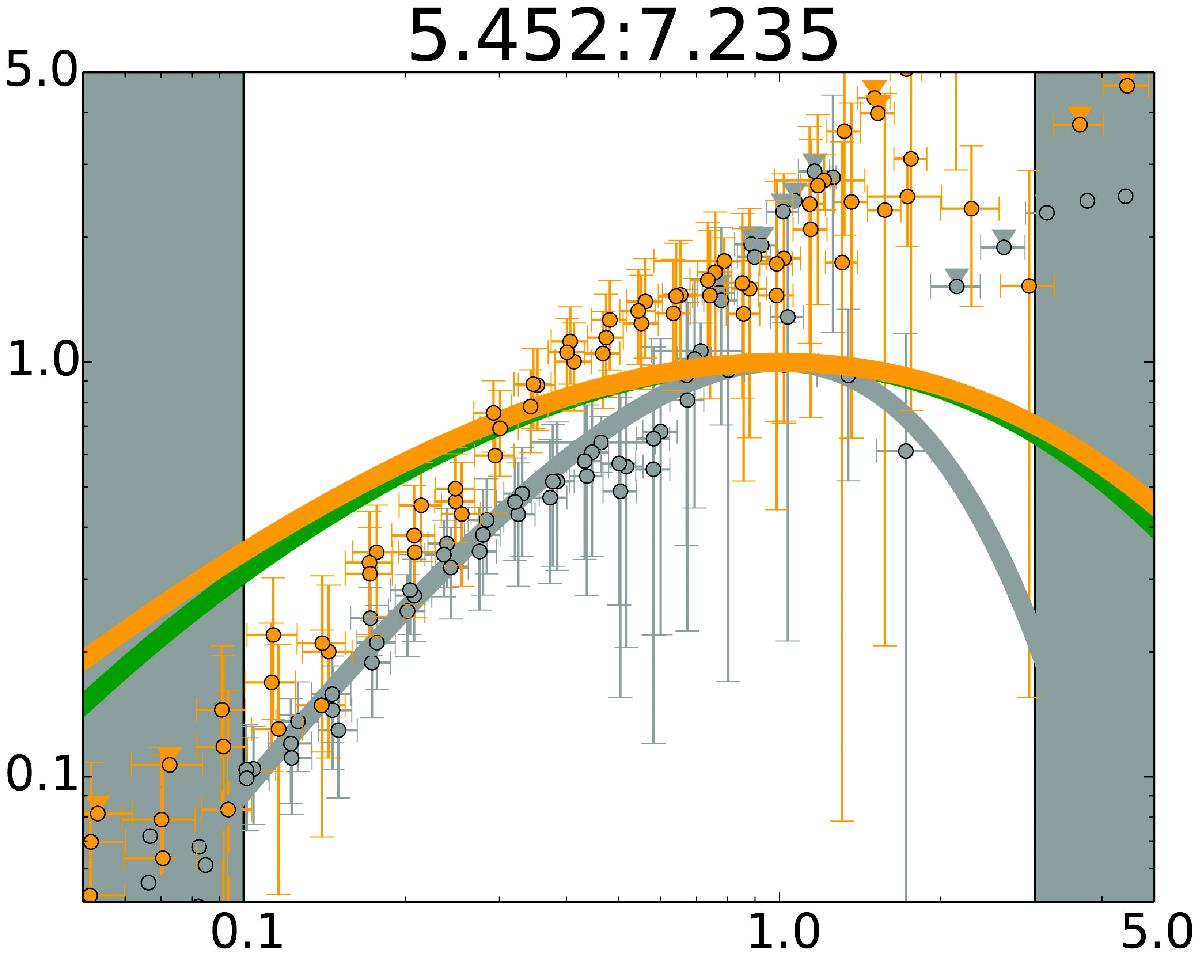
Comparison of the convolved data points and the respective convolving model curves for the same spectrum of Fig. 8. The orange curve and data points are obtained from the Maxwellian-SBPL fit, and the grey ones are from the COMP fit. The Maxwellian synchrotron function is also overlaid (green). For display purpose, the bin size has been increased by a factor of 5 relative to the standard bin size.
Current usage metrics show cumulative count of Article Views (full-text article views including HTML views, PDF and ePub downloads, according to the available data) and Abstracts Views on Vision4Press platform.
Data correspond to usage on the plateform after 2015. The current usage metrics is available 48-96 hours after online publication and is updated daily on week days.
Initial download of the metrics may take a while.