Fig. 7
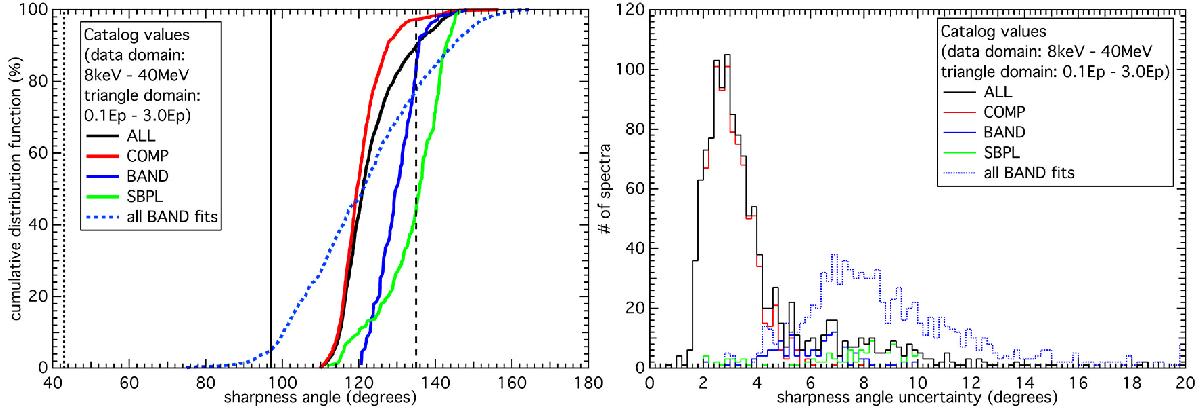
Left panel: cumulative distribution functions of θ for the catalog full energy domain fits. Right panel: distributions of σθ. The limits of the normalized blackbody (dotted line), single-electron synchrotron (solid line), and synchrotron emission from a Maxwellian electron distribution (dashed line) are overlaid. In the above legends, COMP represents the Comptonized model, BAND represents the Band function, SBPL represents the smoothly broken power law, and ALL represents the overall population (COMP + BAND + SBPL). The blue dotted line and histogram show fit results if all spectra are fit using BAND, provided that they are converged fits, but not necessarily the best fit when compared to other models.
Current usage metrics show cumulative count of Article Views (full-text article views including HTML views, PDF and ePub downloads, according to the available data) and Abstracts Views on Vision4Press platform.
Data correspond to usage on the plateform after 2015. The current usage metrics is available 48-96 hours after online publication and is updated daily on week days.
Initial download of the metrics may take a while.