Fig. 6
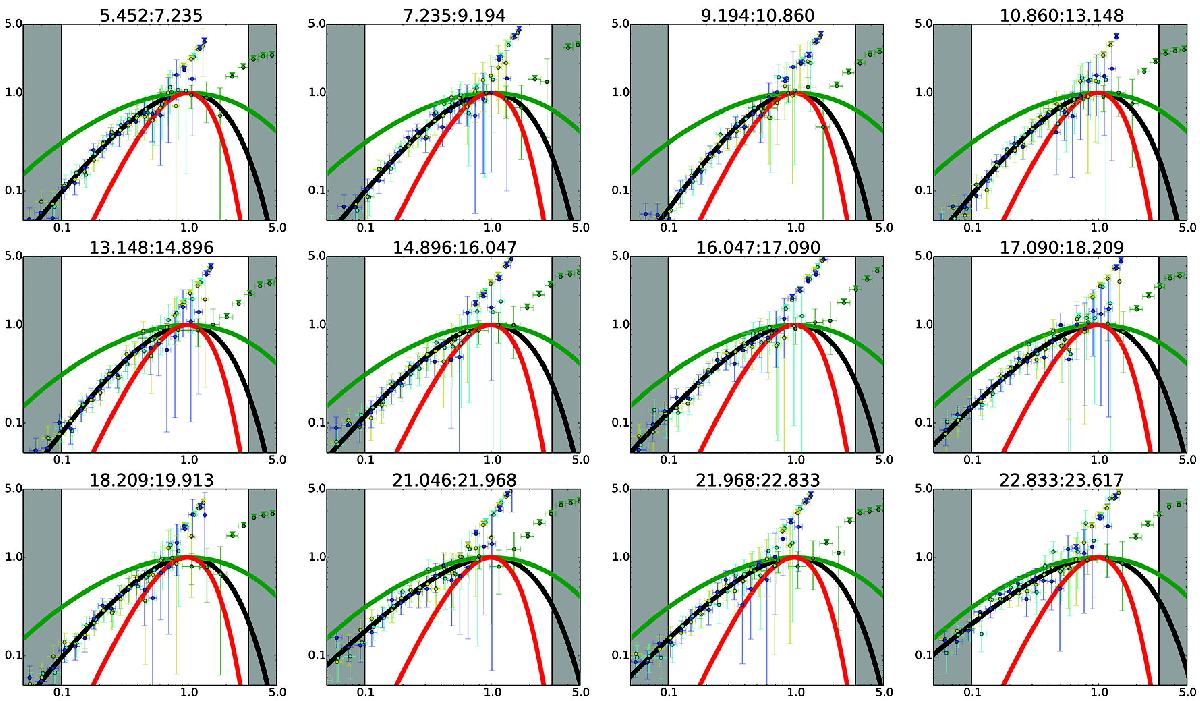
Spectral evolution of GRB 100414.097 with the normalized blackbody (red), Maxwellian synchrotron (green), and the best-fit model (black) overlaid. Time evolves from top left to bottom right, and the time since trigger is labeled at the top of each snapshot spectrum, in units of seconds. The peaks of the models are all normalized to (x,y) = (1,1). Data points and the shaded regions are plotted as described in Fig. 4. For display purpose, the bin size has been increased by a factor of 5 relative to the standard bin size.
Current usage metrics show cumulative count of Article Views (full-text article views including HTML views, PDF and ePub downloads, according to the available data) and Abstracts Views on Vision4Press platform.
Data correspond to usage on the plateform after 2015. The current usage metrics is available 48-96 hours after online publication and is updated daily on week days.
Initial download of the metrics may take a while.