Fig. 5
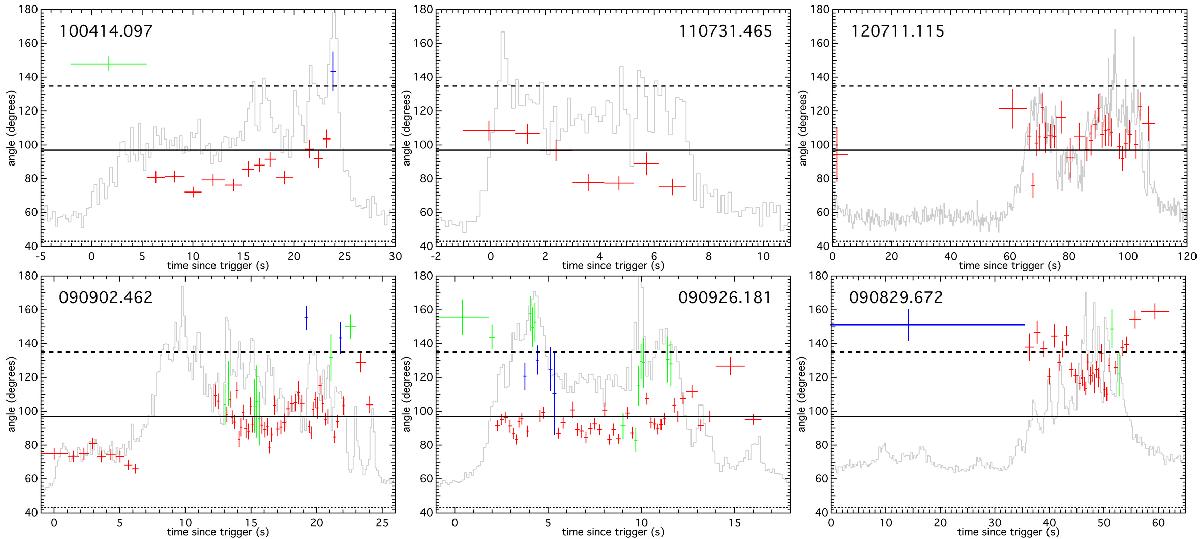
Six examples of evolutionary trends of θ. Red, blue, or green color indicates that the best-fit model is COMP, BAND, or SBPL, respectively. The light curves are overlaid in arbitrary units. The limits of the normalized blackbody (dotted line), single-electron synchrotron (solid line), and synchrotron emission from a Maxwellian electron distribution (dashed line) are overlaid.
Current usage metrics show cumulative count of Article Views (full-text article views including HTML views, PDF and ePub downloads, according to the available data) and Abstracts Views on Vision4Press platform.
Data correspond to usage on the plateform after 2015. The current usage metrics is available 48-96 hours after online publication and is updated daily on week days.
Initial download of the metrics may take a while.