Fig. 4
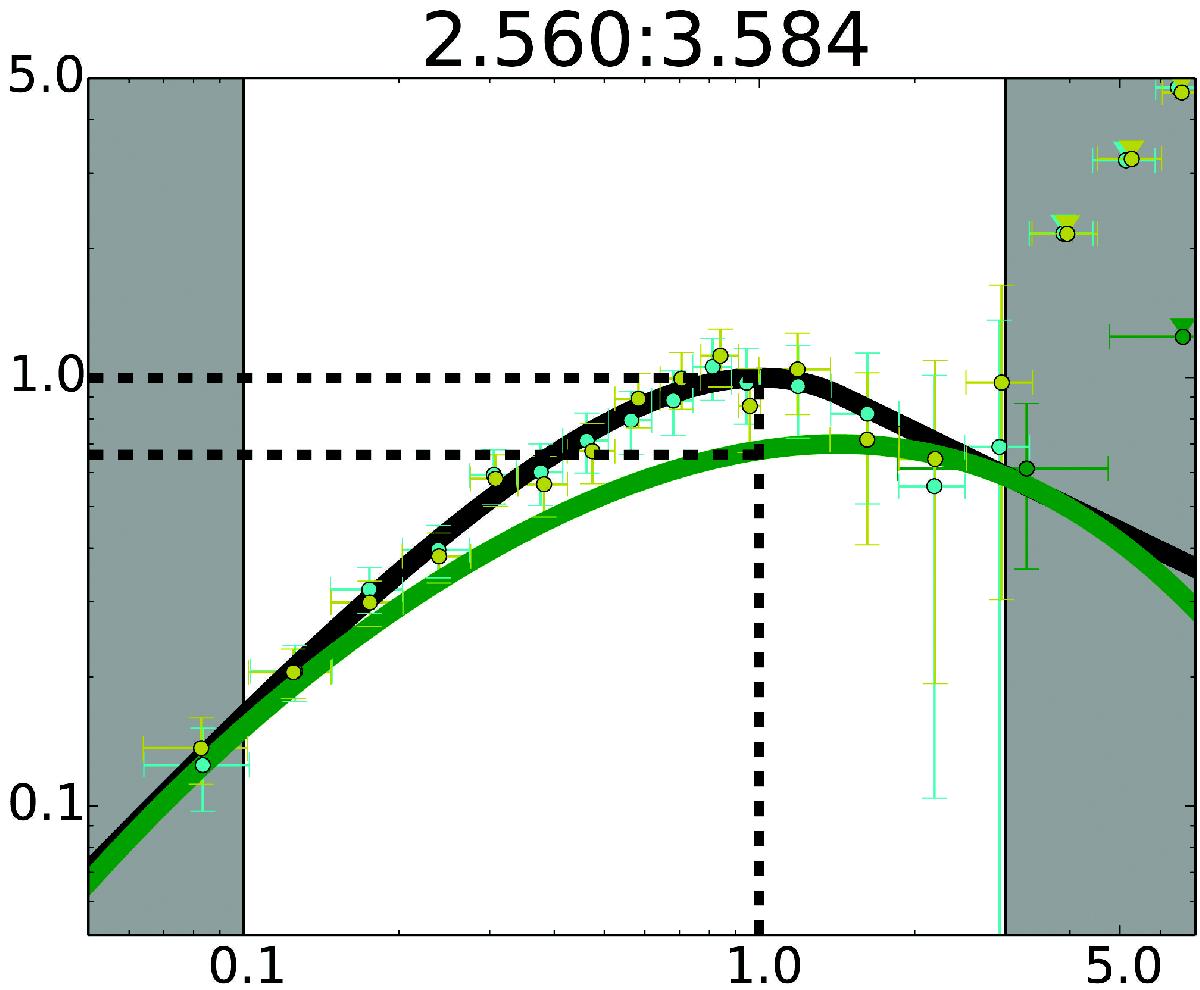
Example spectrum taken from GRB 101014.175 (2.560−3.584 s), showing the maximum contribution to the best-fit model by the Maxwellian synchrotron function, at x = 1. The normalized Maxwellian synchrotron (green curve) and the best-fit model (black curve) overlaid. The black dashed lines show the peak position of the best fit model and the relative normalized flux levels. In this particular spectrum, the Maxwellian fraction is about 65% at x = 1. The shaded regions show the boundaries xleft = 0.1 and xright = 3.0. Deep green data points are from the BGO detector and the others are from the NaI detectors. Triangles represent upper limits. For display purpose, the bin size has been increased by a factor of 5−10 relative to the standard bin size.
Current usage metrics show cumulative count of Article Views (full-text article views including HTML views, PDF and ePub downloads, according to the available data) and Abstracts Views on Vision4Press platform.
Data correspond to usage on the plateform after 2015. The current usage metrics is available 48-96 hours after online publication and is updated daily on week days.
Initial download of the metrics may take a while.